Management console setup
Notes before installation
Install Oplon LManagement Console it is very simple because it does not use any installers and is completely self-conscious.
Being the suite Oplon S.A.A.I. a product intended for business-critical mission-critical environments only staff who have completed the course and passed the exam are authorized to certify the installation and maintenance of the products in operation. All certified persons have a document issued by Oplon Networks srl.
Preparing to install
To install Oplon Management Console you must acquire an Oplon S.A.A.I. license, in one of its distributions, and then from the received media (CD/DVD or PenDrive) or to download use the file that contains it. The product file is a single compressed format file with the following sample names:
LBLManagementConsole_aai_00x_00x_00x.zip
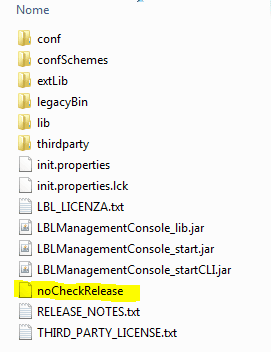
The first part indicates the contained distribution and the number indicates the release, subrelease, build. Once the file has been unzipped the content is as follows:
├LBLManagementConsole_aai_00x_00x_00x I LBL_HOME

├── conf (Directories with configuration files)

│ └── template_rhe.xml property

├── confSchemes (Directory with XSD Local Verification Schemes)

│ └── license.xsd property

├── extLib (External Library Run-Time Directories)

│ ├── jcommon-1.0.16.jar

│ ├── jfreechart-1.0.13.jar

│ ├── jfreechart-1.0.13-swt.jar

│ └── jlfgr-1_0.jar

├── LBL_LICENZA.txt (License Management Console)

├── LBLManagementConsole_lib.jar (LBLR Application Library)

├── LBLManagementConsole_start.jar (Starter)

├── LBLManagementConsole_startCLI.jar (command line and SDK starter)

legacyBin ├── (Legacy Directory)

├── lib (System Direction)

hardLogs │ └── (Logs)

├── RELEASE_NOTES.txt (Release Notes)

├── thirdparty (Third-party directory licenses and libraries)

│ ├── jfreechart-1.0.13.zip

│ ├── JFreeChart_licence-LGPL.txt

│ └── jlfgr-1_0_LICENSE.txt

└── THIRD_PARTY_LICENSE.txt (Third-party license list description)
The boot files in graphical or command mode have been highlighted in red.
JVM JRE/JDK Installation
-
MS Windows: Installing the JVM for MS Windows is recommended by installing it through the installer Oracle official. In fact, this mode automatically sets Java to start with double click in the .jar files that contain the startup descriptors.
-
Linux: It is recommended to use JRE/JDK in Compressed Binary tar.gz mode`
-
Solaris: It is recommended to use JRE/JDK in Compressed Binary tar.gz mode
-
MAC OS: Use the JRE/JDK in MAC format and run the installation
Licenses (no longer needed)
From release 2.0.3 Oplon Management Console no longer needs activation licenses.
NB: If you proceed with an update from the previous release, delete the license.xml file from the LBL_MANAGEMENT_CONSOLE_HOME/conf directory.
Start of the application from MS Windows
From MS Windows, if you installed JRE/JDK from the installer, simply double-click the file:
(LBL_HOME)/LBLManagementConsole_start.jar
If the bindings of the .jar extension are correct, the splash screen should appear and then the login request should appear:
If the splash screen and application do not appear, try running from command dos e.g.:
C: cd (LBL_HOME)

C: LBLManagementConsole_aai_002_00x_00x-java -jar
LBLManagementConsole_start.jar
Start the application from Linux/Unix
Go to the directory (LBL_HOME) and run:
java -jar LBLManagementConsole_start.jar
Start of the application from MAC OS
From MS Windows, if you installed JRE/JDK from the installer, simply double-click the file:
(LBL_HOME)/LBLManagementConsole_start.jar
Connecting and using key functions
Five buttons appear at the top of the console:
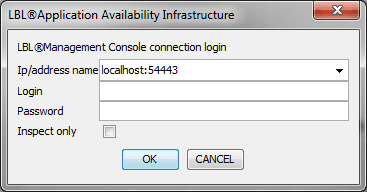
The first makes a new connection to a node, the second closes all console tasks immediately, the third puts the console in lock state by requesting the password again to continue, the fourth allows you to change the system parameters, the fifth starts the Regex Helper, and the fifth shows the information related to the management console. At the press of the first button, the following dialog box appears:
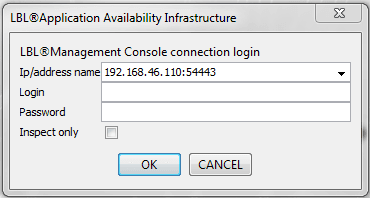
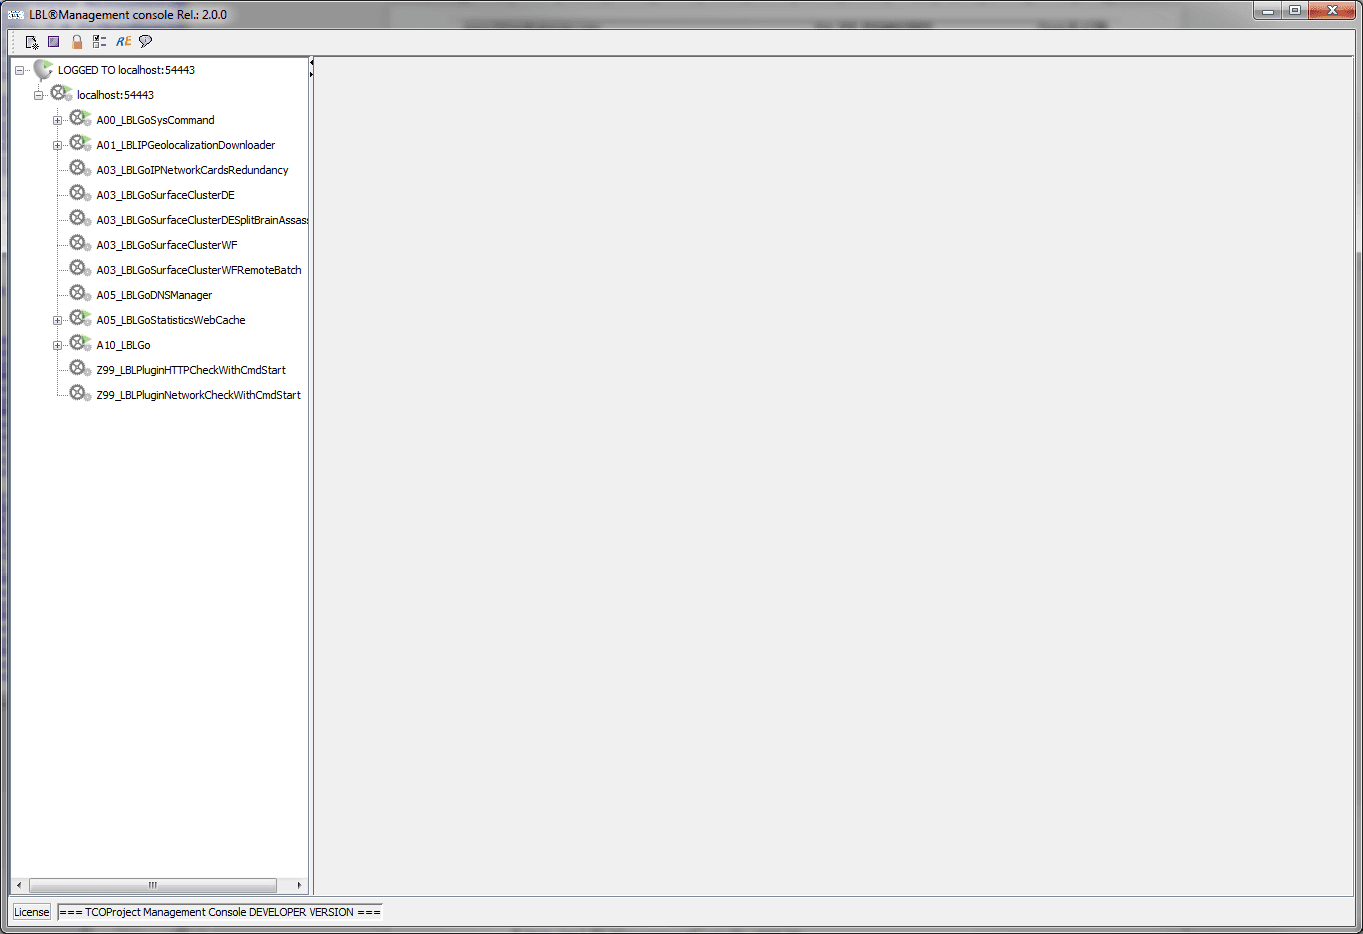
The first time the window proposes as ip/address name [localhost:54445]. Later, by storing up to 20 nodes, it will propose the last connection made. Once login and password have been spelled correctly, the console prompts the node for Oplon service processes by displaying them in a tree.
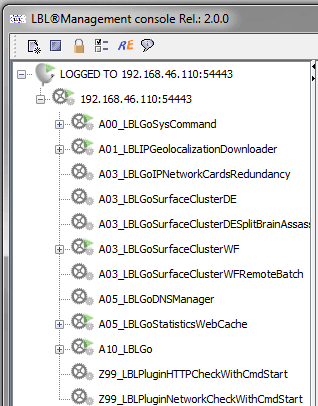
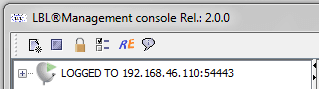
The first level, highlighted in blue, identifies the connection, the second level identifies the node, and the elements, at the third level, represent processes.
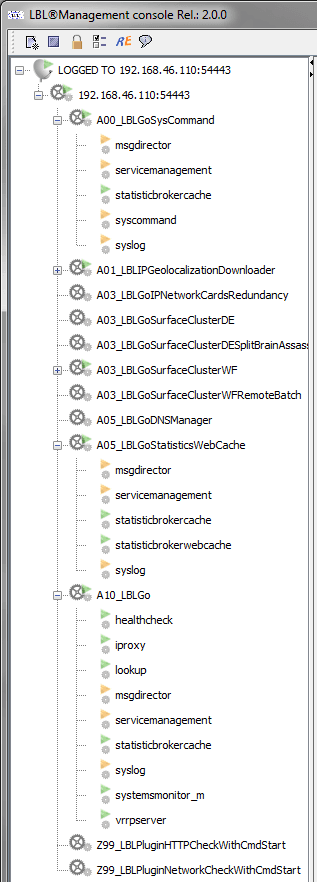
If you open the third level, you can view the services that make up the processes. These services can be of type Oplon Kernel, highlighted by an orange triangle when they are running, and of type Oplon User highlighted by a green triangle when they are in a running state.
By pointing the mouse over the tree nodes and pressing the right button, you can see the actions that can be performed at the same time:
In the leaf of the tree that identifies the Oplon node, you can do the following:
-
Promote garbage
promotes process garbage Oplon Monitor
-
Clean all errors signals cleans up error reporting of all processes managed by the monitor
-
Import process Imports a process in Oplon S.A.A.I. format.
-
Export license downloads the job license Oplon Monitor
-
Install process licemza Oplon Monitor
-
Reinit monitor config Resets the monitor configuration values. This reinitialization is for the notification configuration part; HTTP email and post, and for cluster node configurations. The paragraph
<params>is not reloaded. The paragraph<params>unization during runtime because it contains the values of the management listener. -
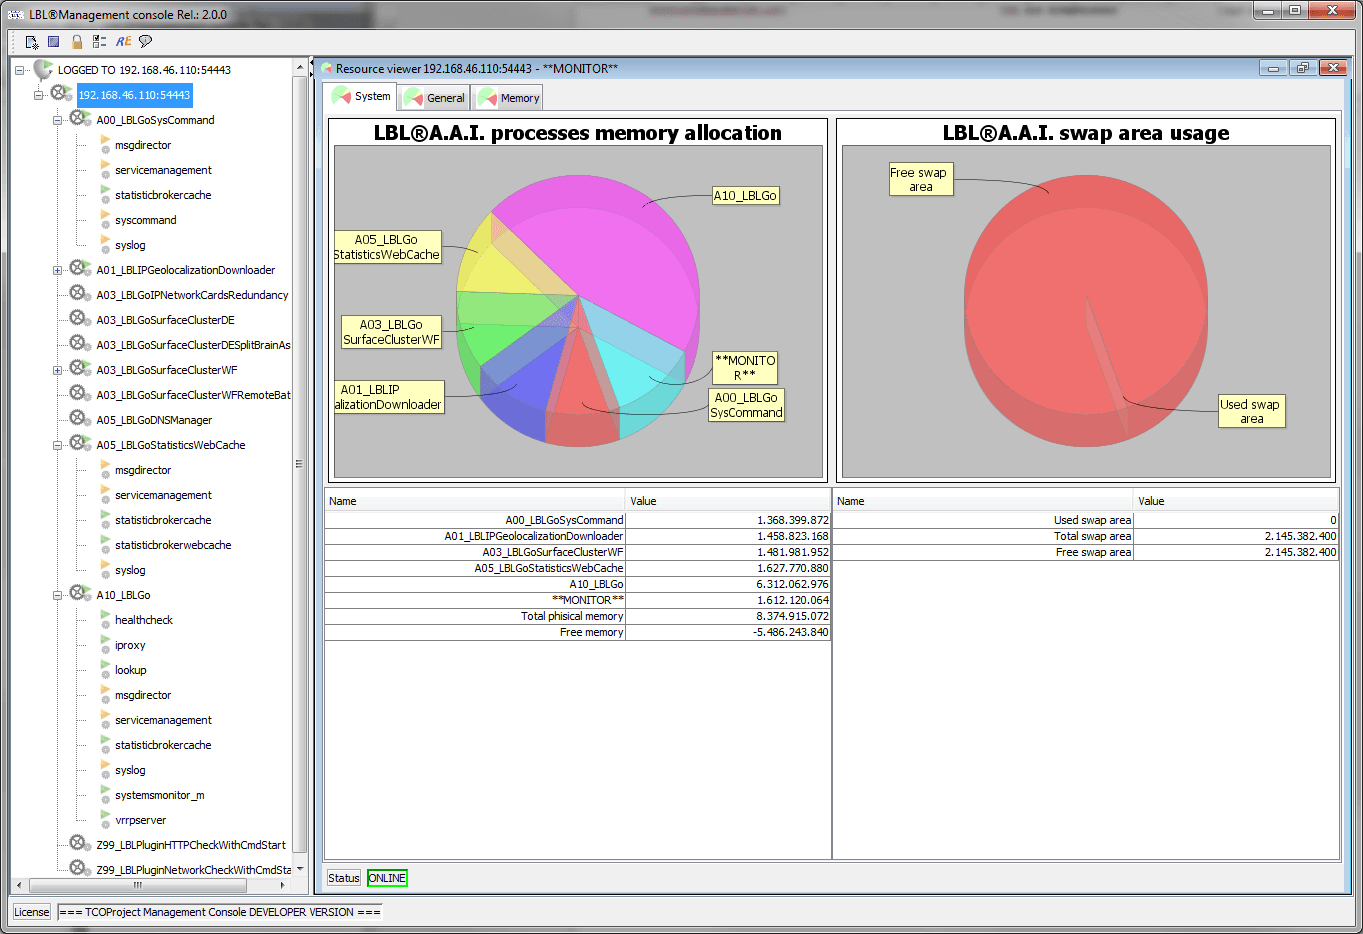
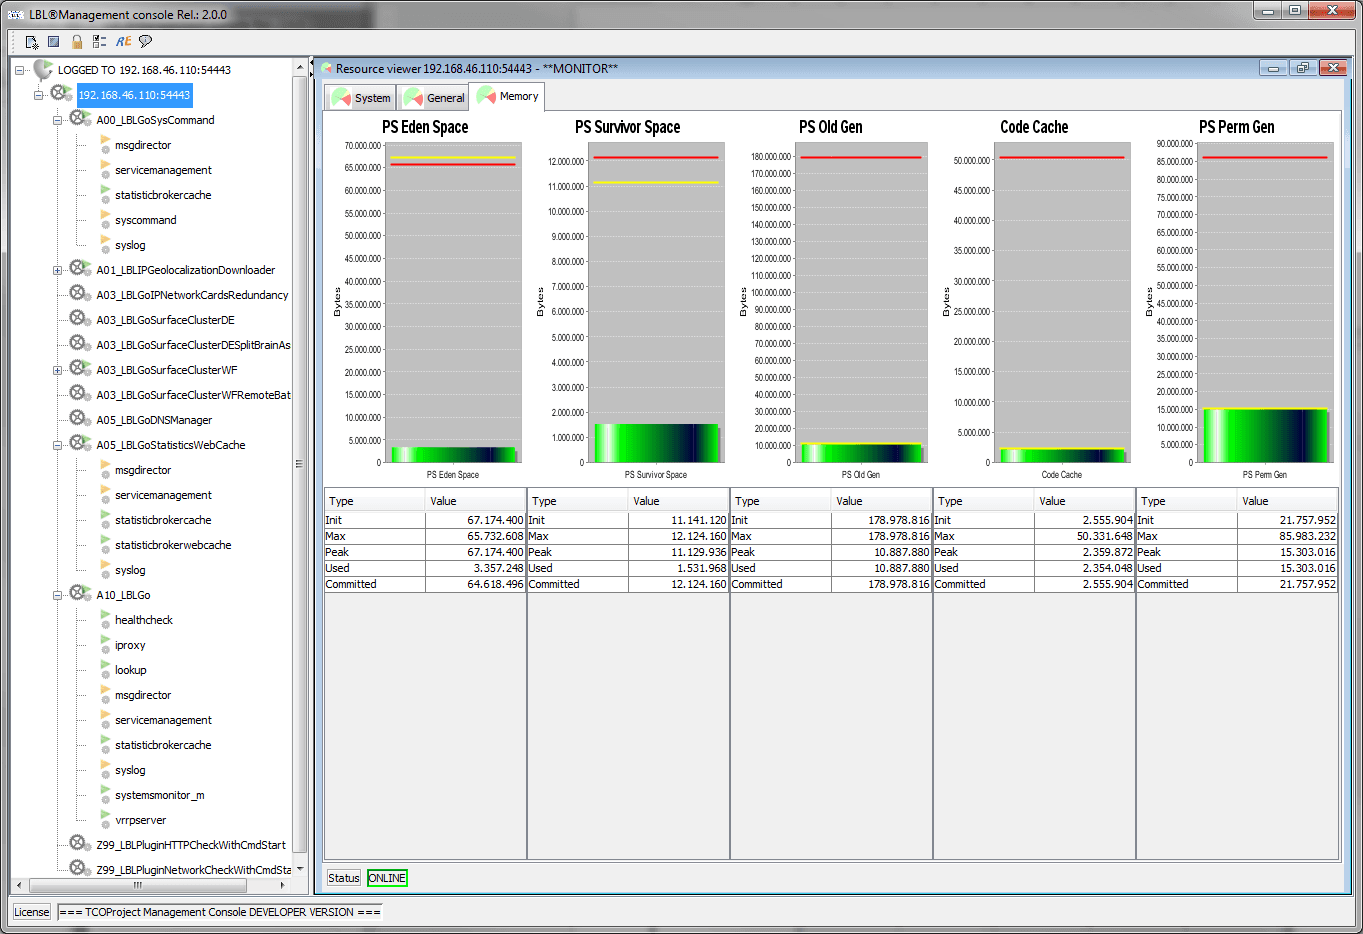
Resource viewer Opens the view of resources for that process on the right side of the window.
The resource viewer displays 3 analysis modes:
-
System
Displays two quadrants indicating the occupancy of system resources related to memory and swap area
-
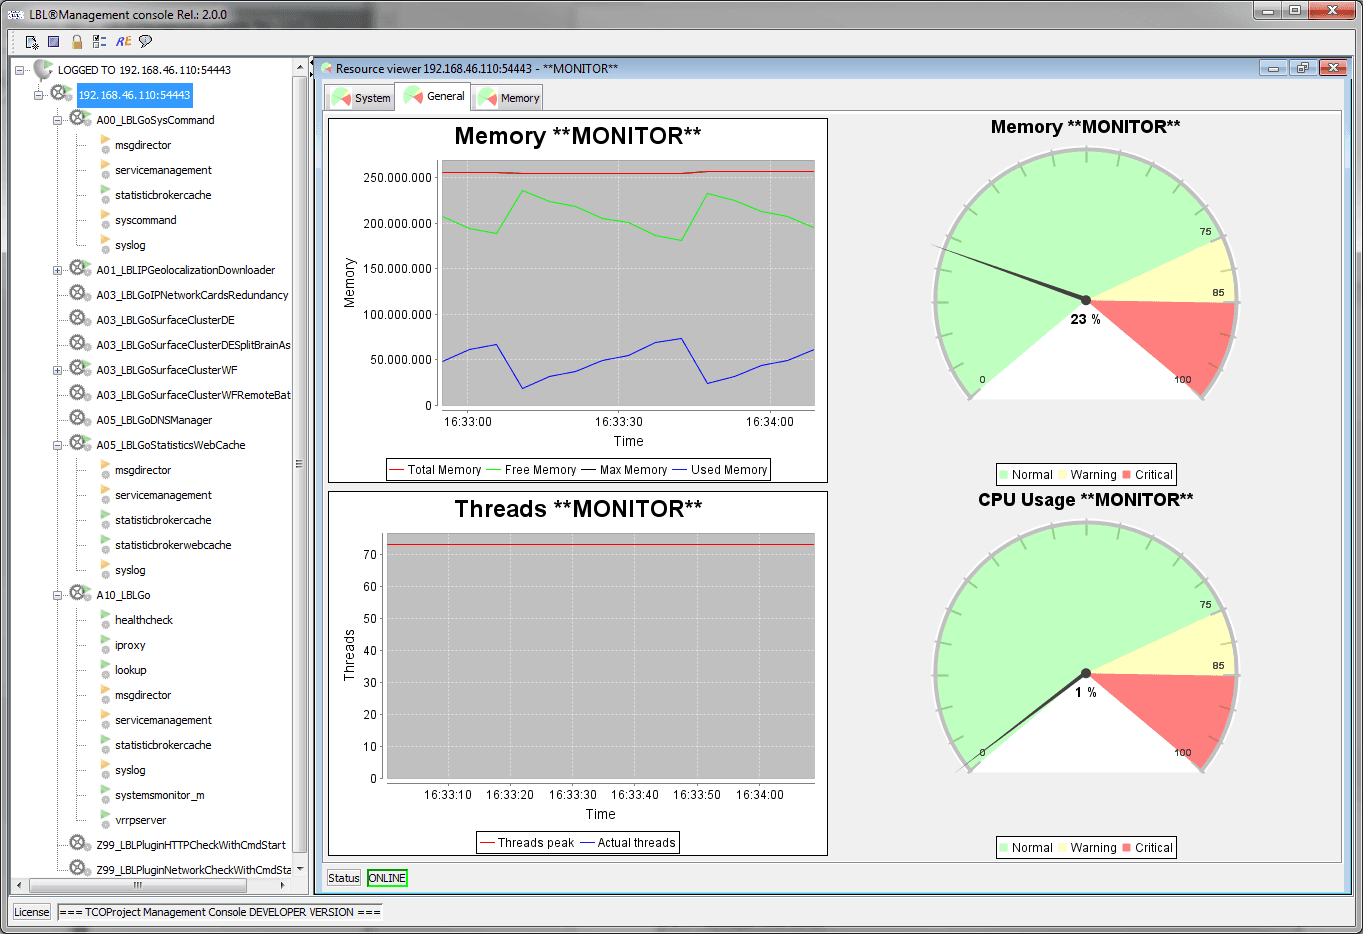 General, New10
4 quadrants are displayed that graphically expose the status of the
Monitor process.
General, New10
4 quadrants are displayed that graphically expose the status of the
Monitor process. -
Memory This view highlights the memory usage of the JVM.
-
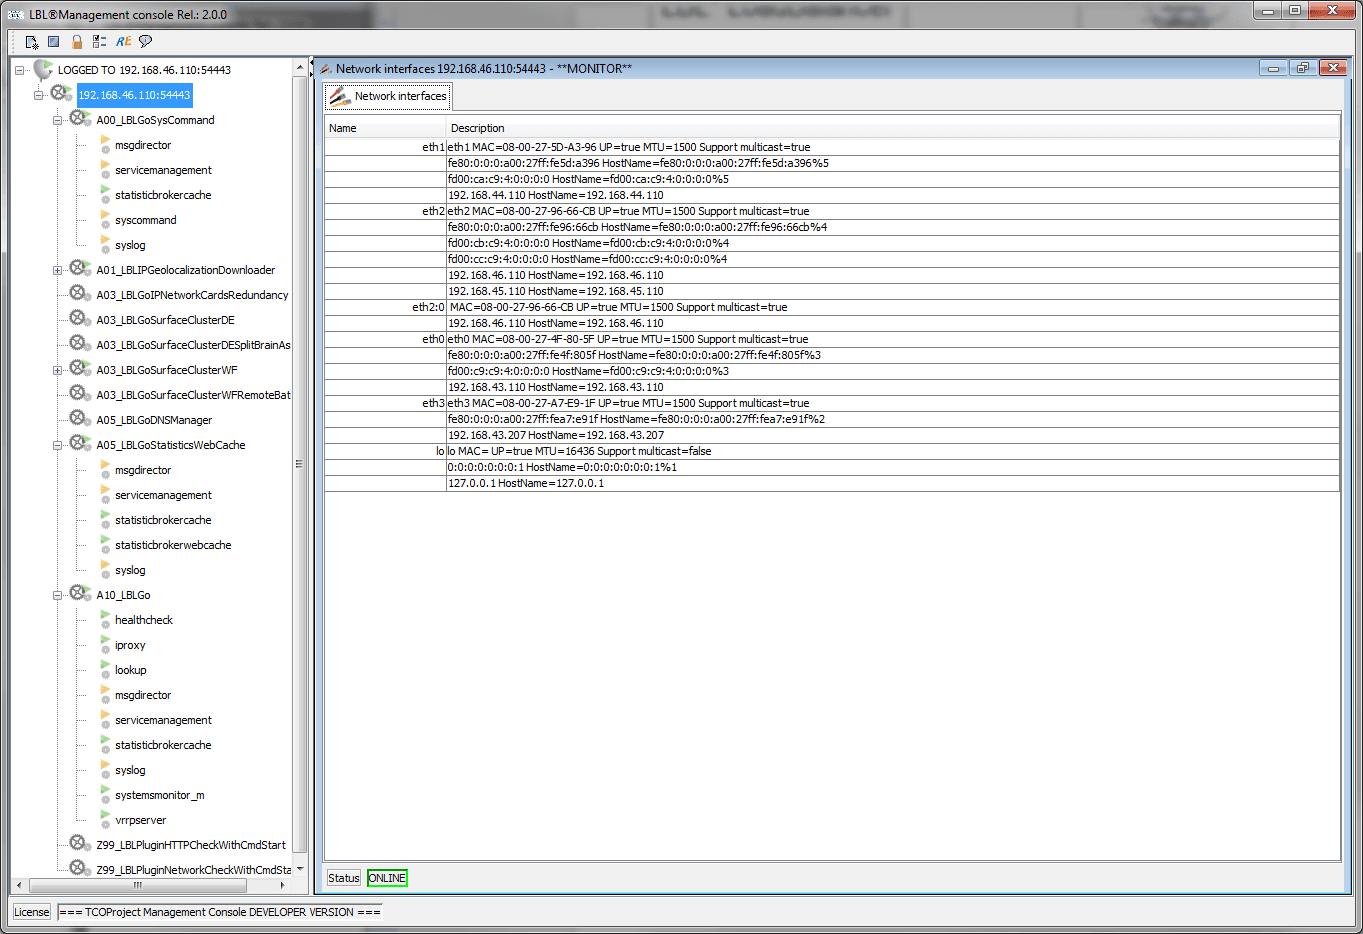
Network interface
Displays a window with a list of network interface characteristics. The view updates automatically as the network configuration changes.
-
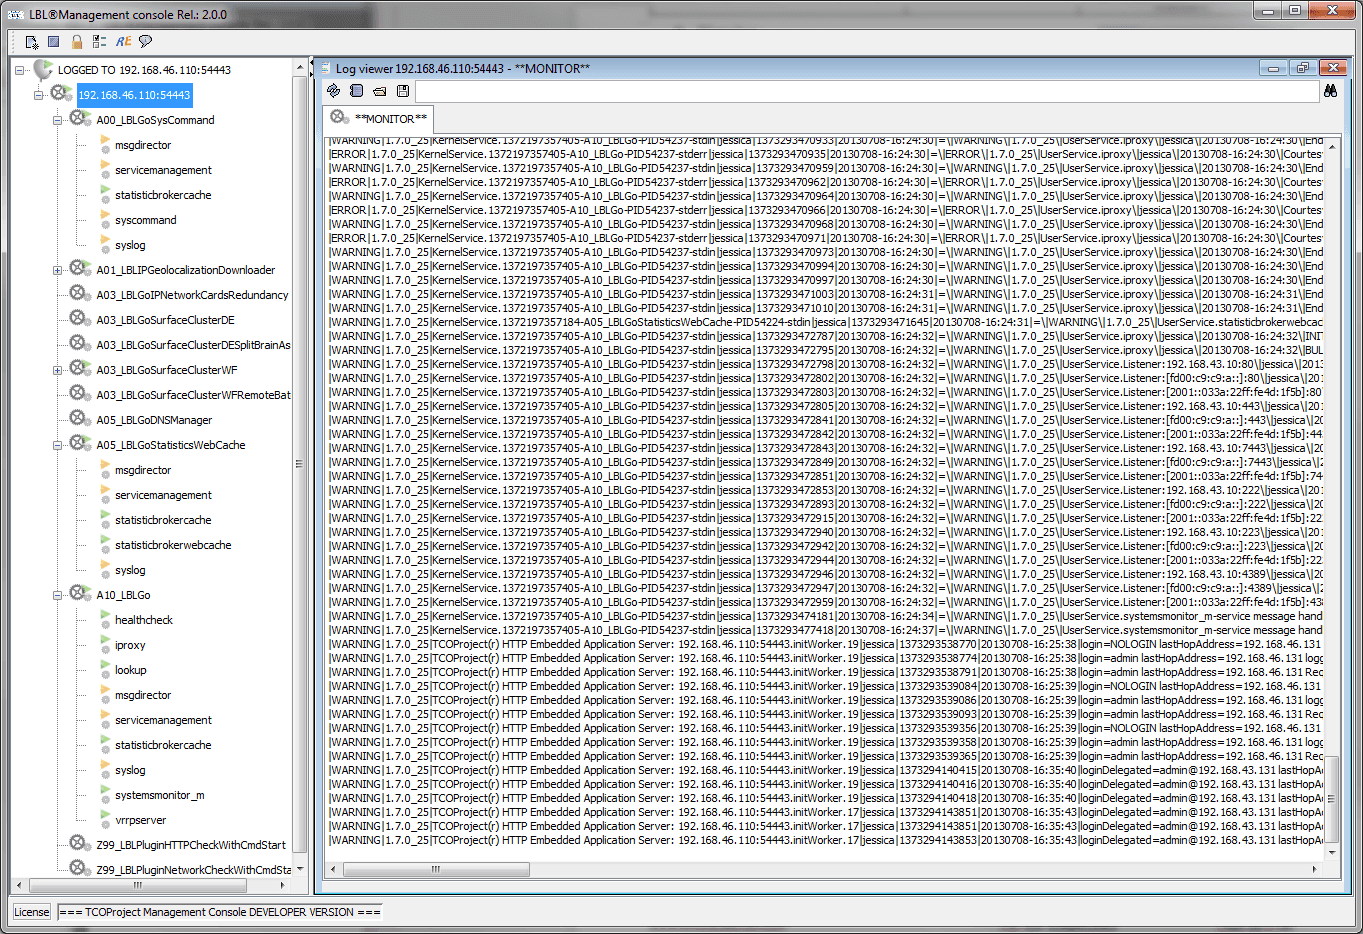
View log
Allows you to view the log, search for information through regular expressions, save the log locally for further processing.
-
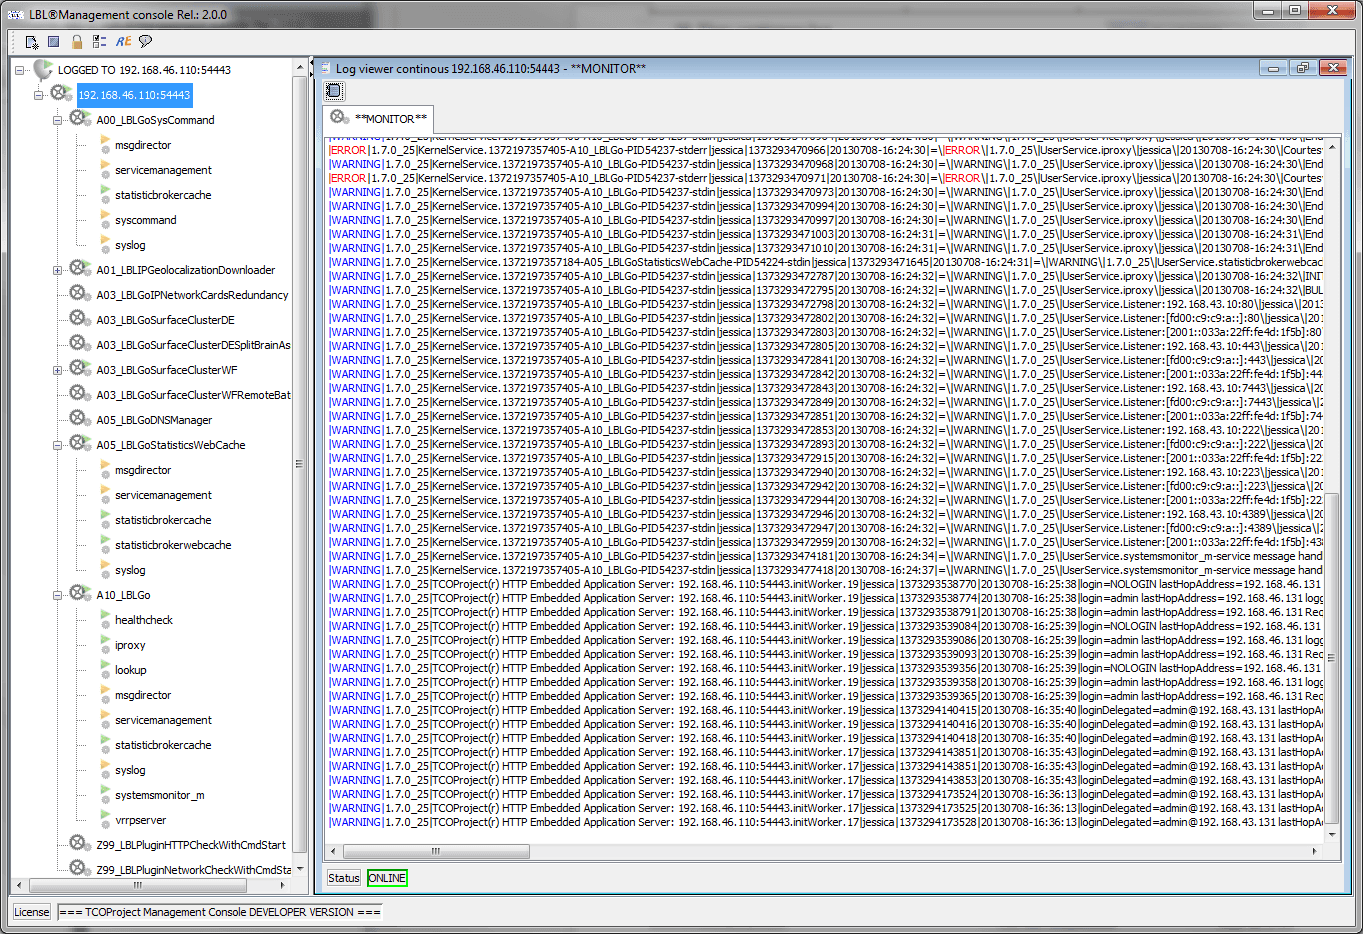
View continuous log
Allows you to view the log continuously. The log is colored to allow you to highlight significant events.
-
Properties property
It is the function that allows you to edit configuration files and verify their formal integrity.
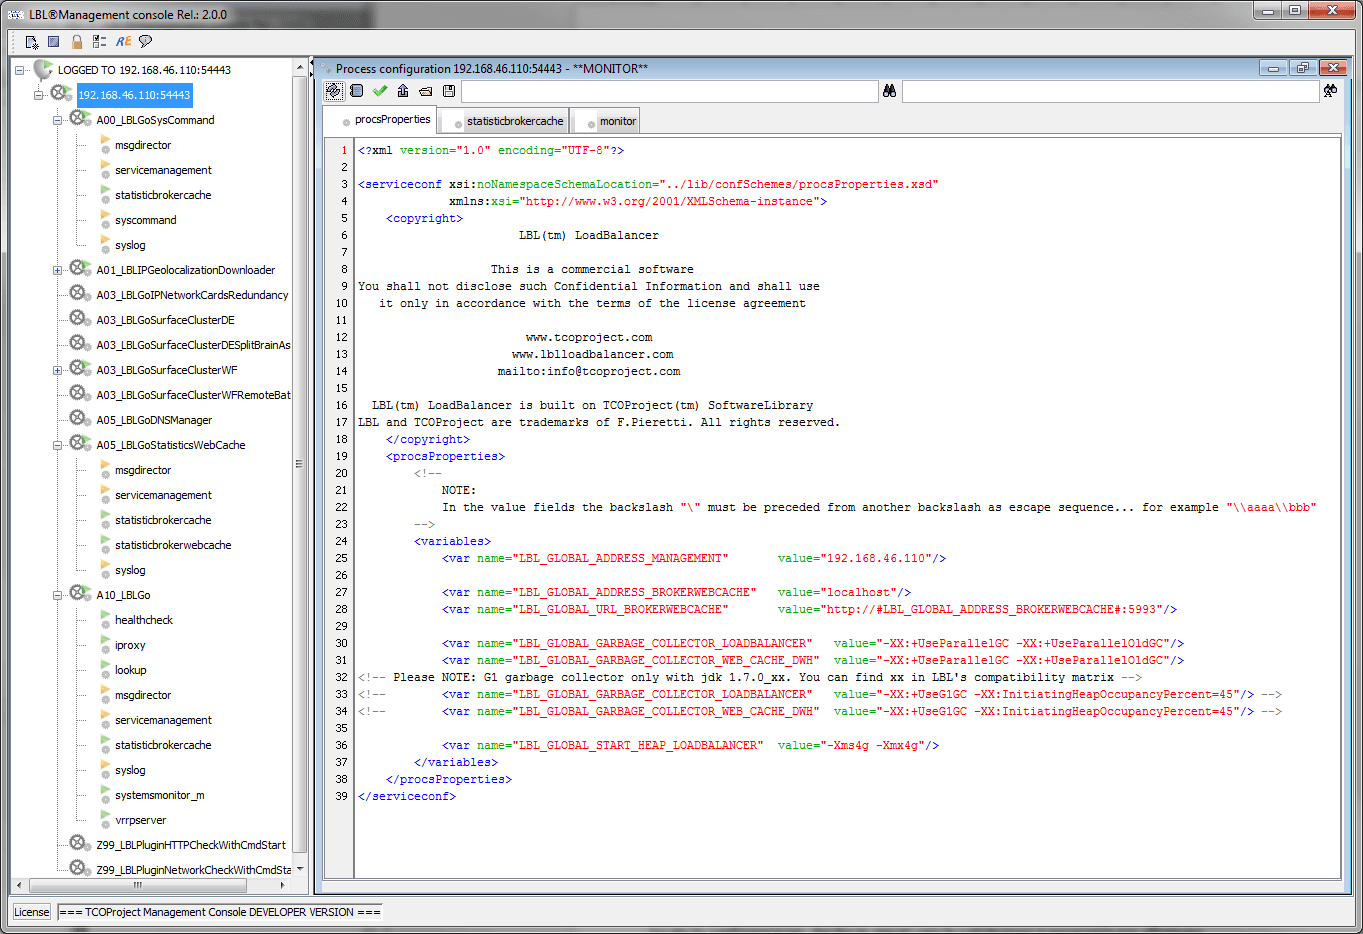
The built-in editor checks the syntax and is able to validate its contents. Un validated content does not allow you to update the configuration. You can also save or load the configuration from local. In these cases, too, validation is required to update files.
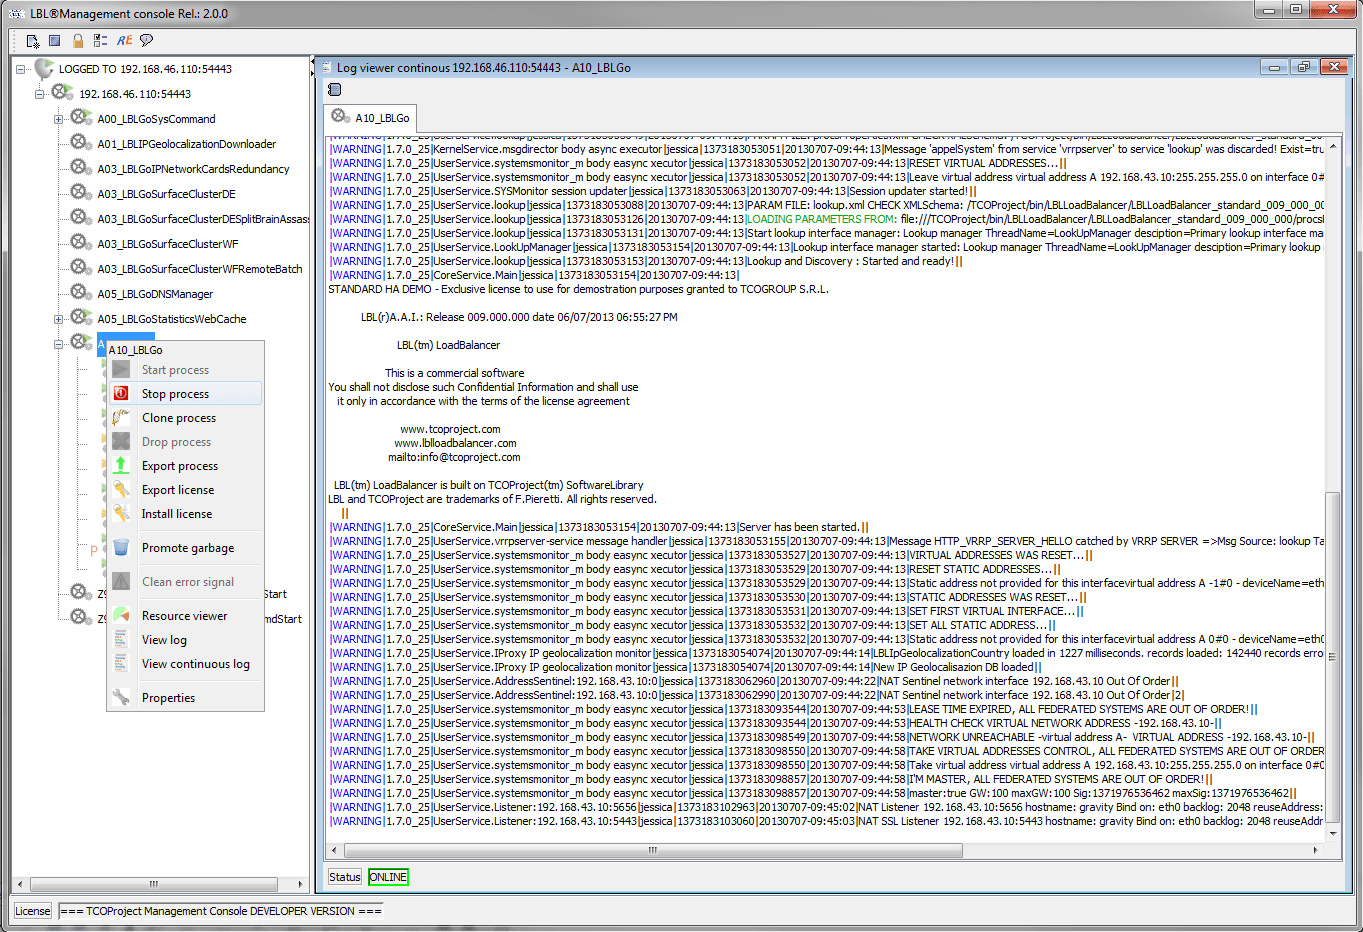
The leaves of the tree that represent the processes if selected open a window with the features to be able to manage them. If the process is an Oplon process the features are fully enabled.
-
Start process Runs the start of the process
-
Stop process Stops the process
-
Clone process Clones the process with a new name
-
Drop process Performs job deletion
-
Export process Export the process
-
Export license downloads the license
-
Install license Install the process license
-
Promote Garbage
Promotes JAVA garbage collector
-
Clean error signal
If abnormal events occur, a visual indicator is activated on the process tree. Once you have verified the event type with this feature, you can delete the visual signaling.
-
Resource viewer
Displays information about the Oplon process. The basic information, memory status, number of threads, and CPU usage are the same for all Oplon processes. On the other hand, the information provided by process type is different.
-
View log
View log with ability to search for content
-
View continuous log
Continuous view of the latest log entries
-
Properties property
Modifying configuration files.
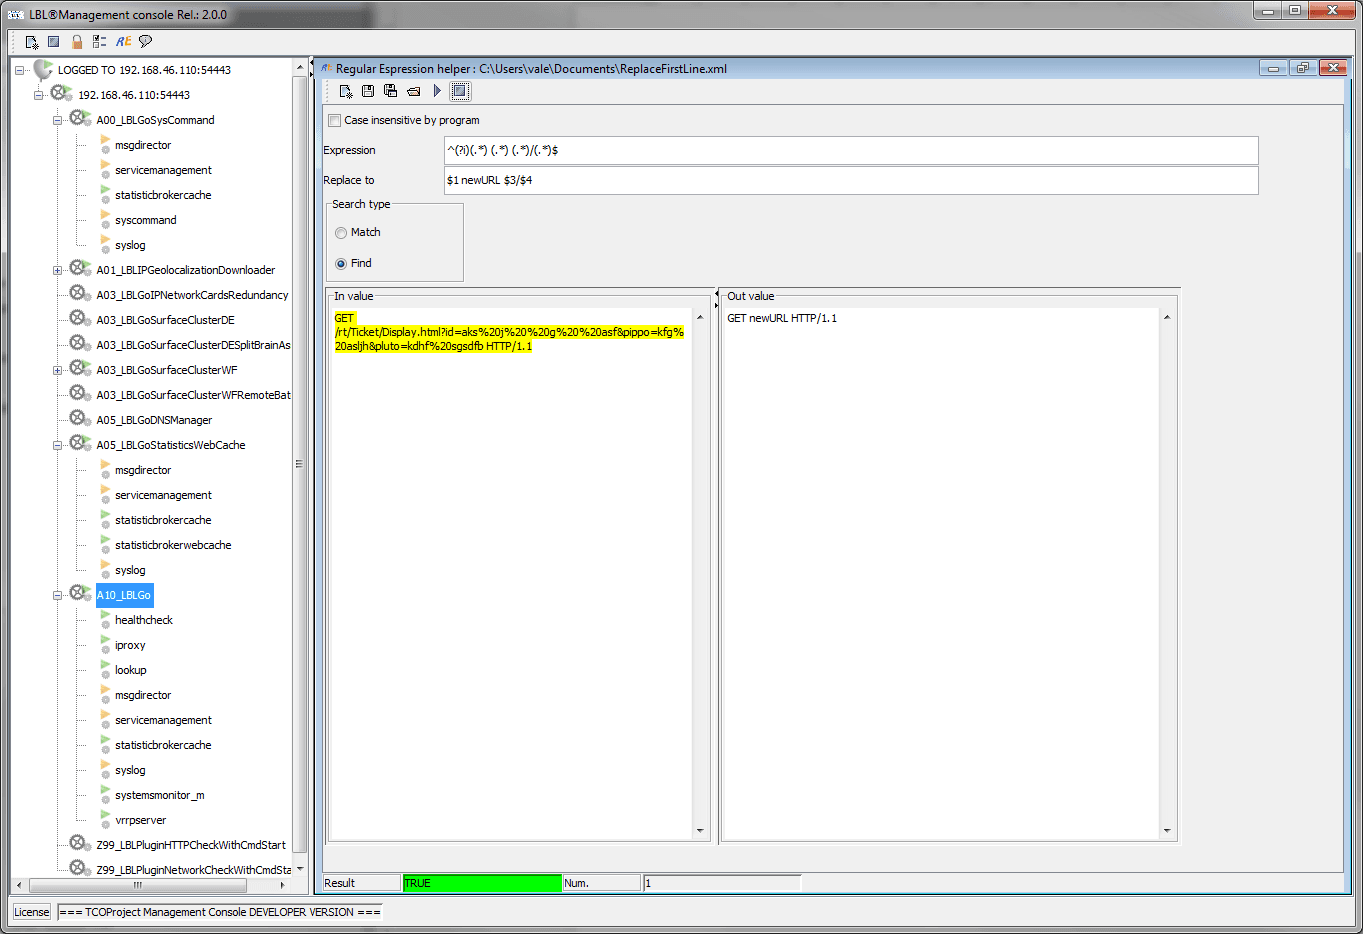
Regex Helper is the feature that can be activated from the Management Console tools bar. This application helps in formulating regular expressions for use in rewriting rules or match contexts.
This tool performs exactly the same functions that Oplon LoadBalancer forwards information, and is therefore a necessary tool for setting the rules and their results correctly.
Rules can be saved locally to facilitate prototyping.
Changing management console properties is possible through the choice of properties:
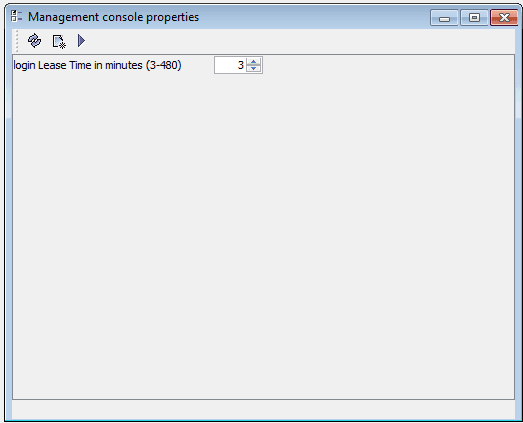 You can change the identity confirmation
prompt property for use of the console from a minimum of 3 minutes to a
maximum of 480 minutes (8 hours). This change is temporary to the work
session and is NOT stored. When the time is set, the lease time value is
returned to 3 minutes, so it needs a new change if you want to set a
different time. This behavior has been chosen to make sure that you
can’t forget about too high lease time settings that are definitely
useful in the setup phase but potentially dangerous during production.
You can change the identity confirmation
prompt property for use of the console from a minimum of 3 minutes to a
maximum of 480 minutes (8 hours). This change is temporary to the work
session and is NOT stored. When the time is set, the lease time value is
returned to 3 minutes, so it needs a new change if you want to set a
different time. This behavior has been chosen to make sure that you
can’t forget about too high lease time settings that are definitely
useful in the setup phase but potentially dangerous during production.Each process can have its own specific views that propose the status of the type of service.
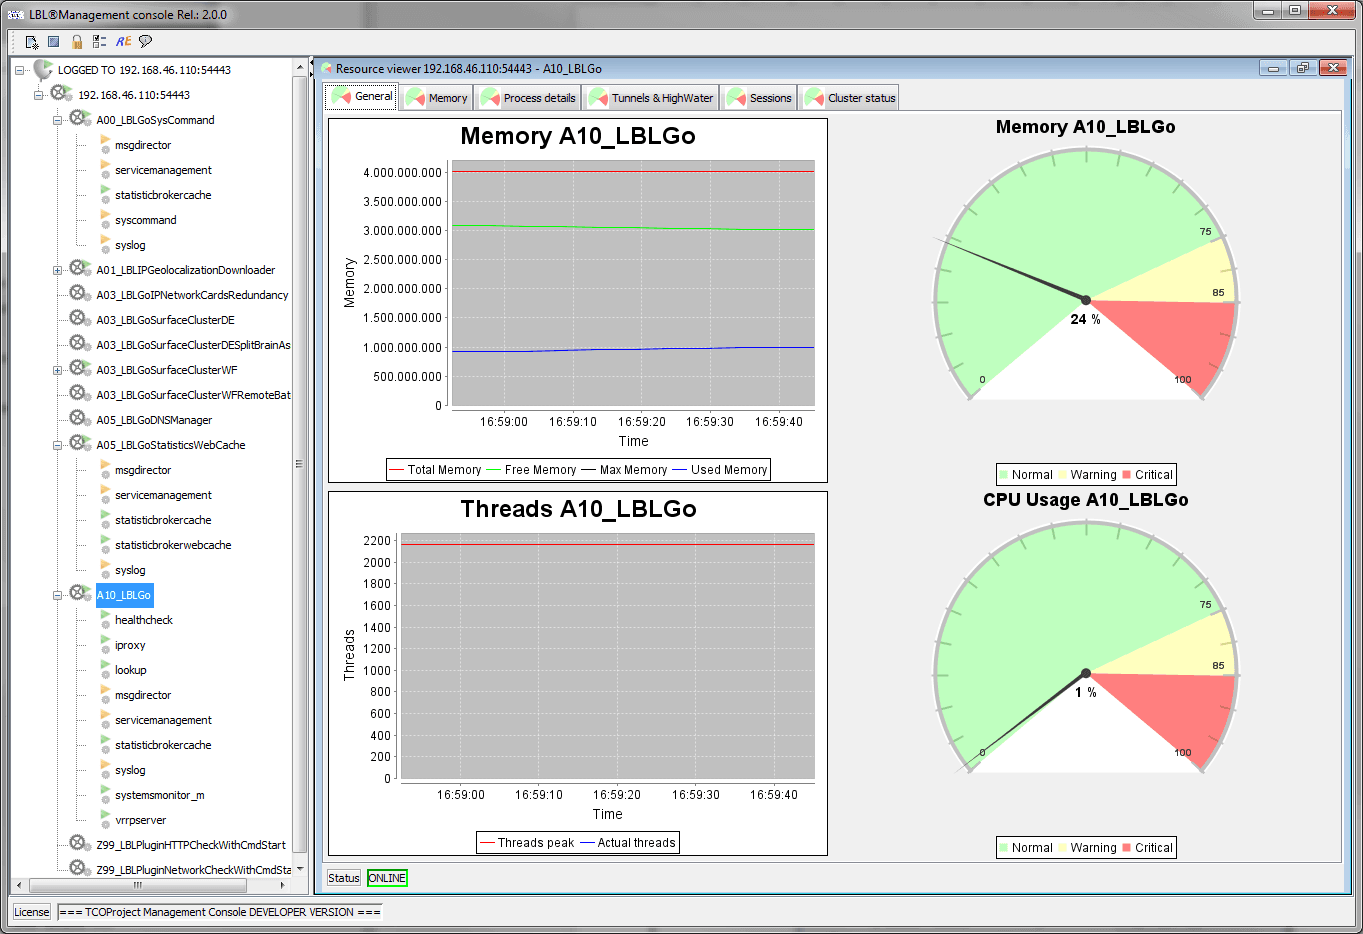
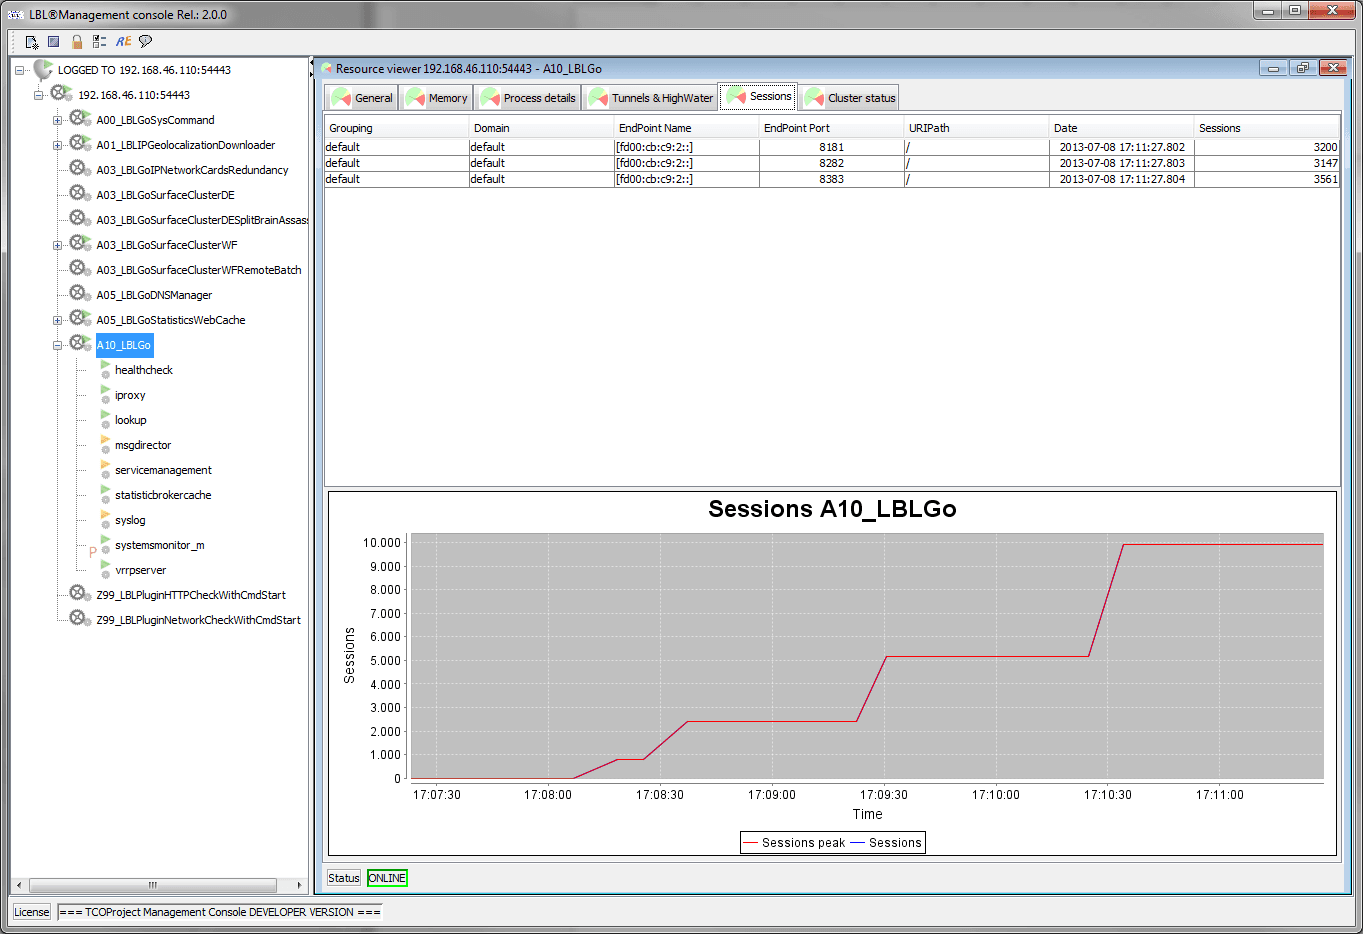
The [General] and [Memory] panels are always present in all Oplon S.A.A.I. processes. The balancing and routing process provides two additional panels related to the instant use of the forwarding engine: [Tunnels & HighWater] and [Sessions].
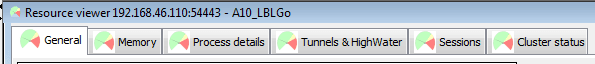
The [General] view proposes the four dials previously seen with the internal memory allocation of the JVM, the number of threads, and CPU usage.
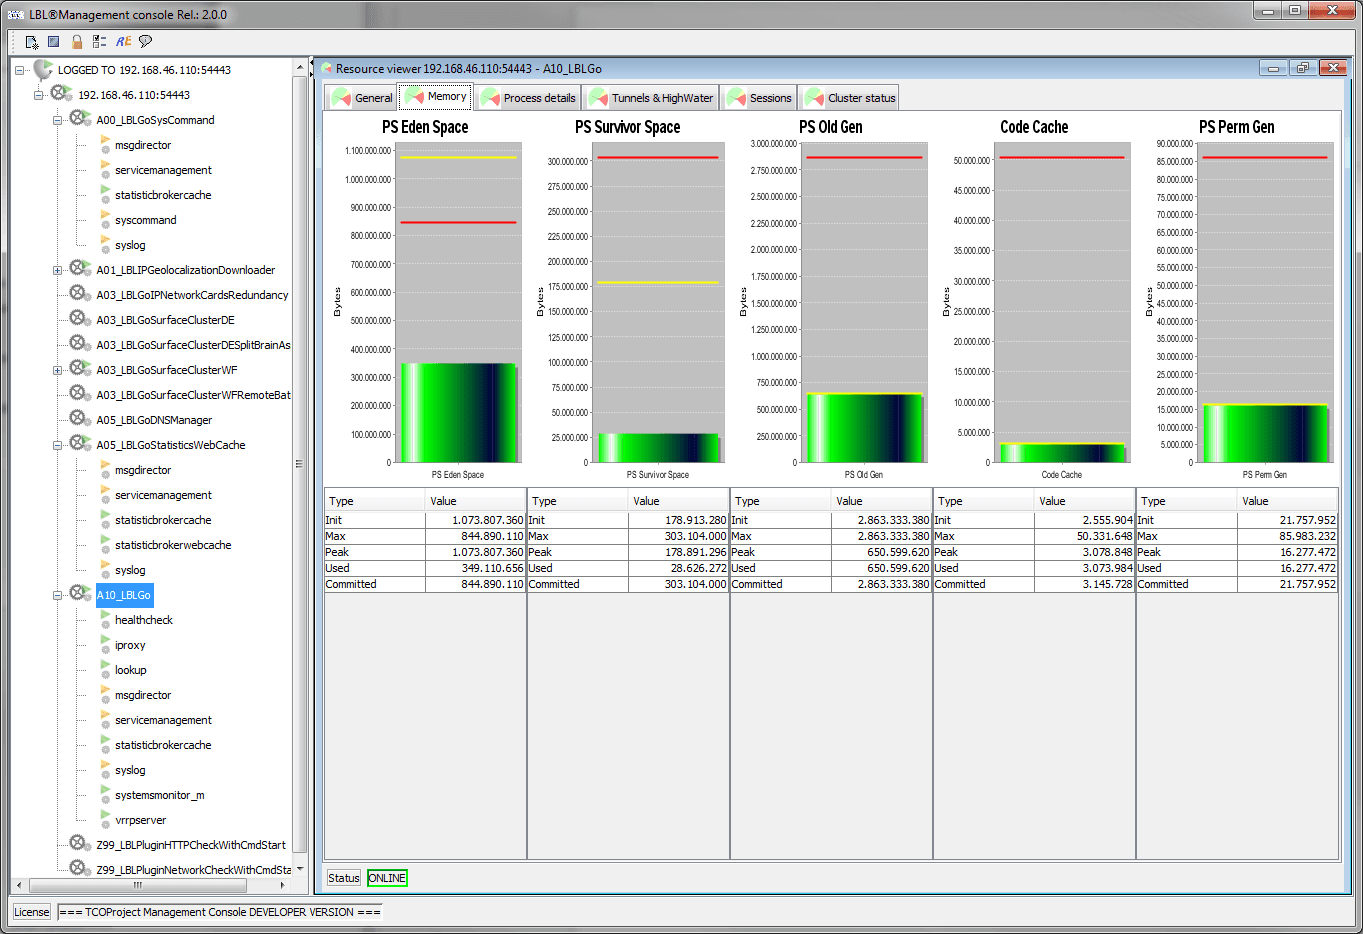
The memory state of the balancing and routing process takes on some importance for sizing and optimizing resource usage.
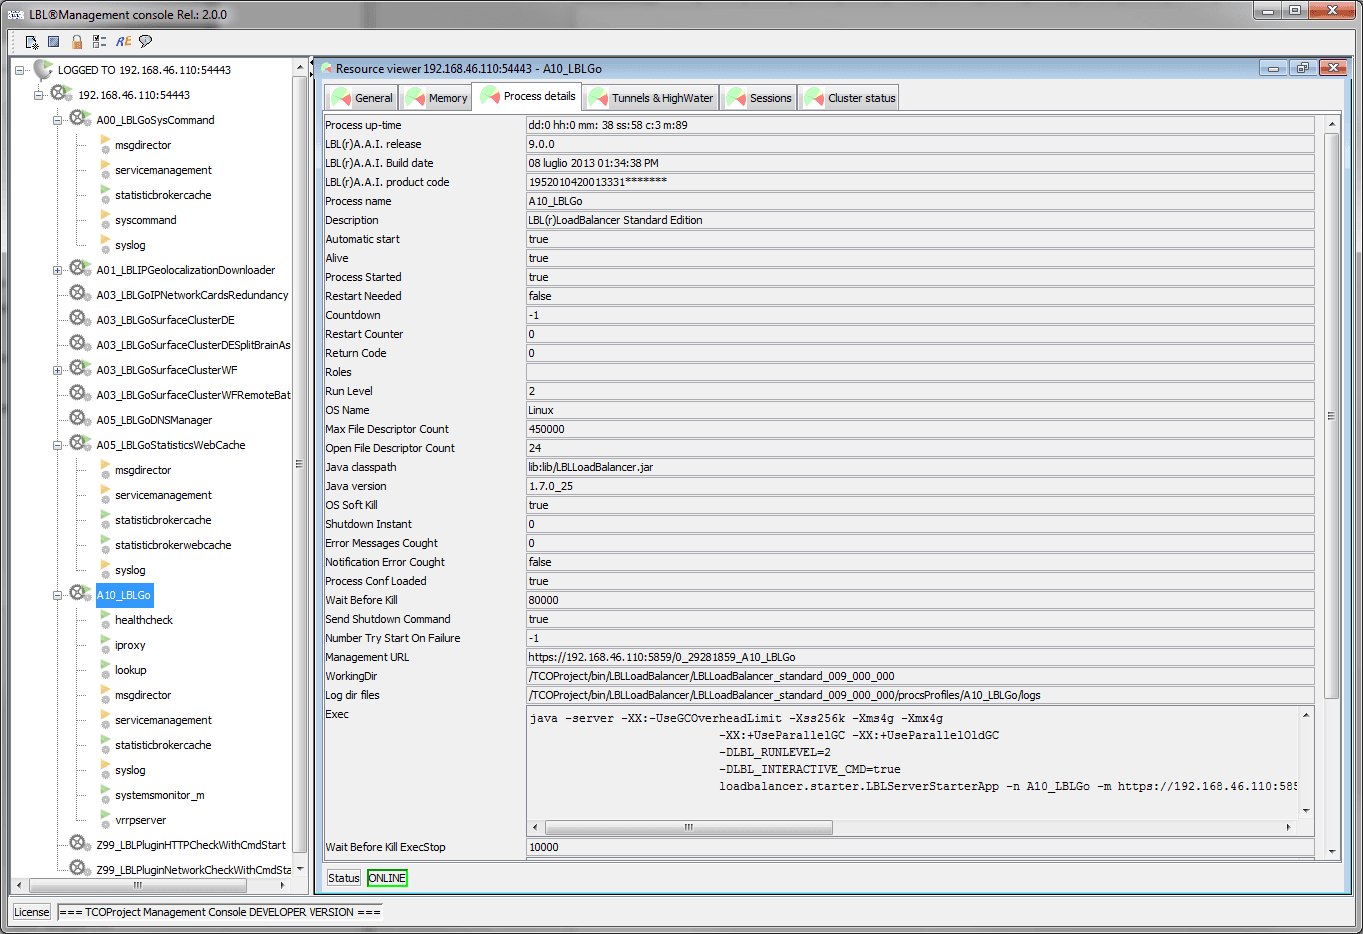
Process details displays the status of the job in text. The visualization is dynamic by being updated every 3 seconds. Among the most interesting data we can see the uptime of the process, the parameters of start, on Linux Unix systems the number of maximum and open dile descriptors…
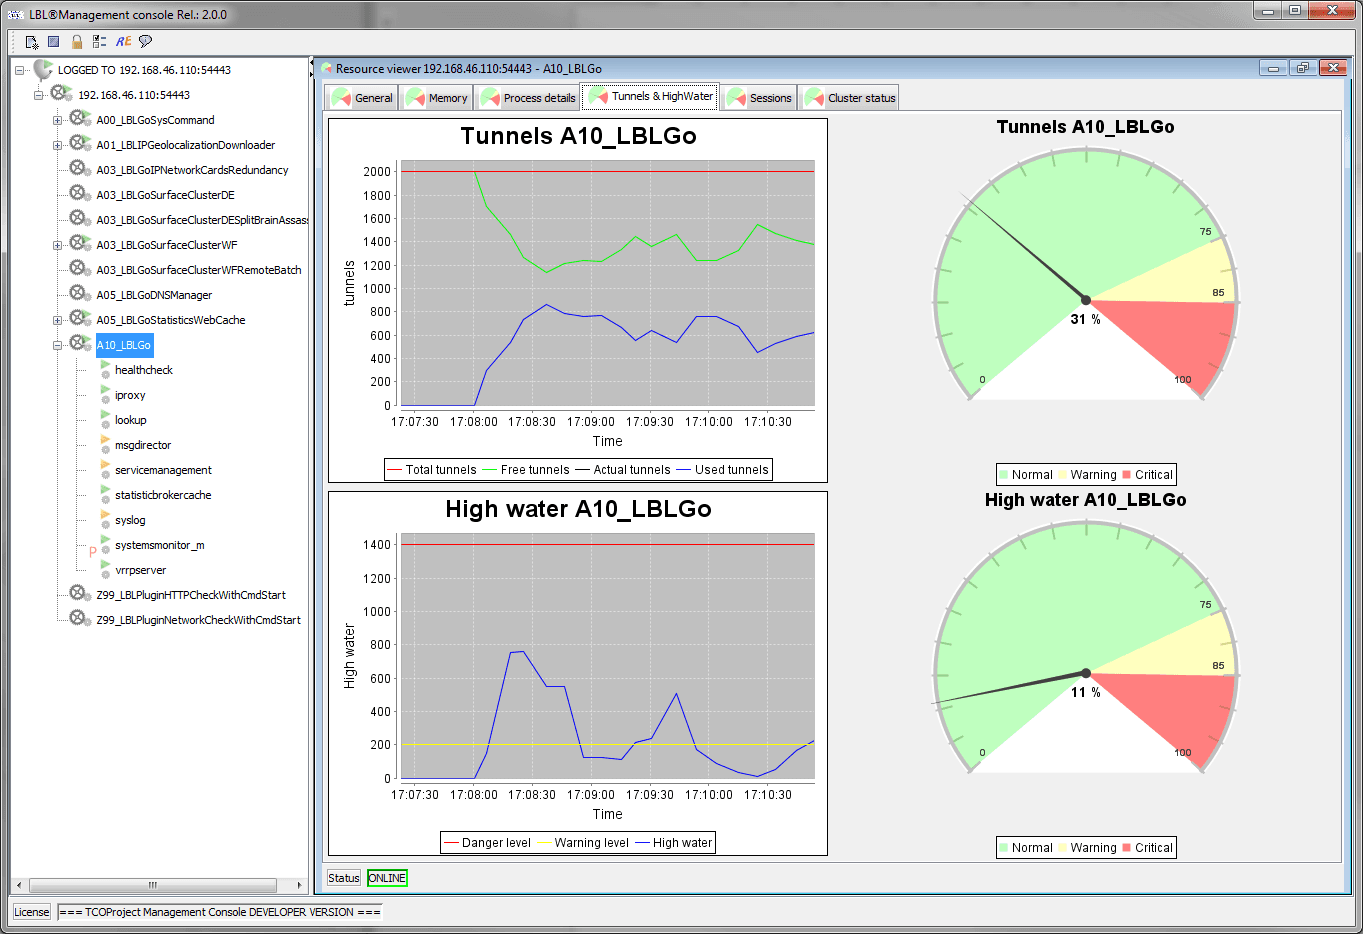
The [Tunnels & HighWater] pannell displays in real time the status of forwarding tunnels passing through the balancing and routing layer. The two dials at the bottom highlight the filling state of the incoming request queue.
The User Sessions panel is a great indicator of service usage. This value is the number of nominal users who are using the services.
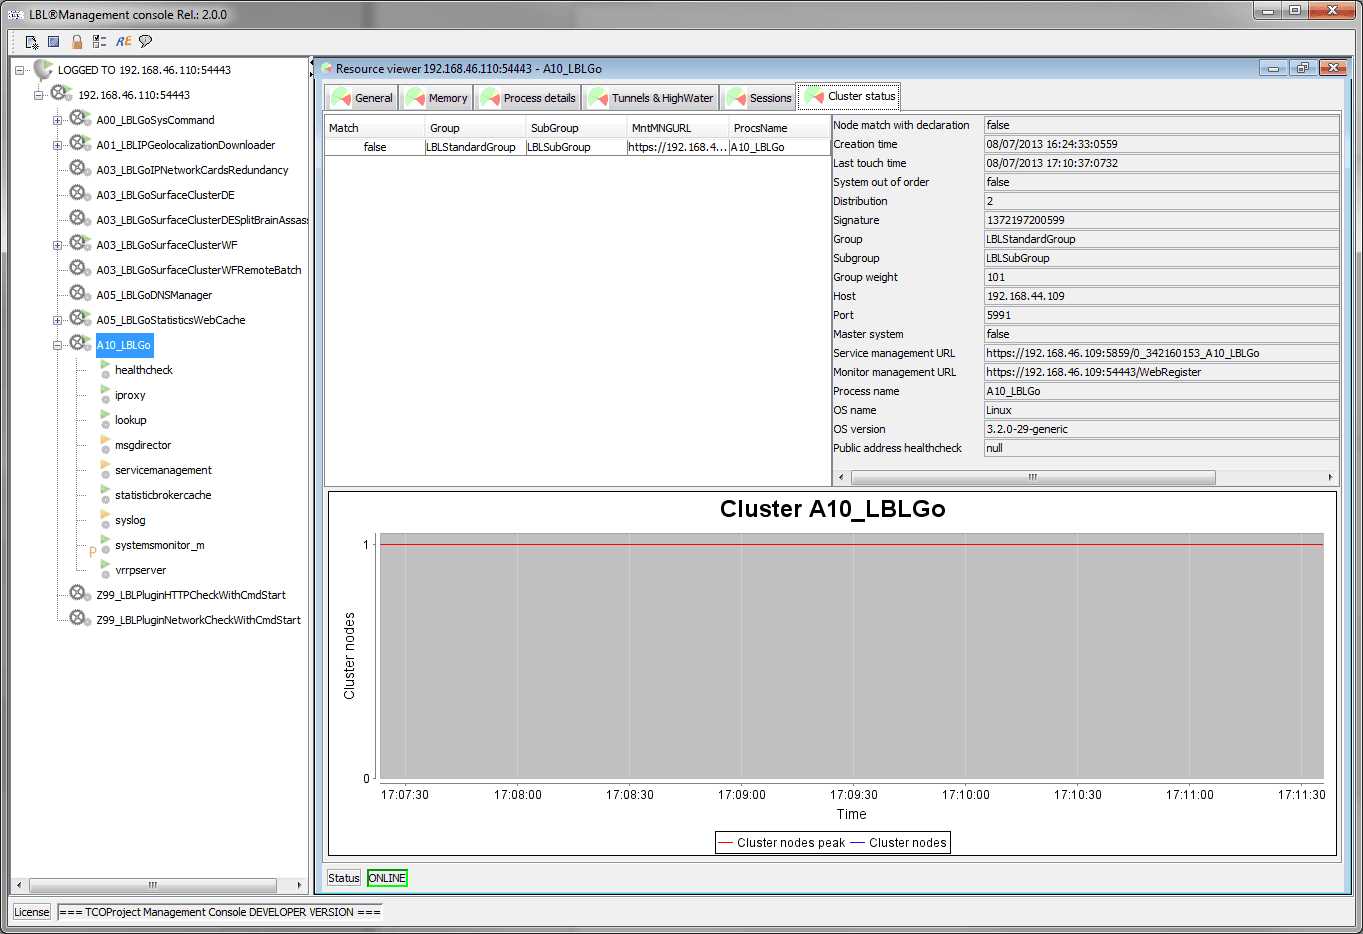
Cluster status is the panel that appears in the case of spontaneous clusters such as balancing jobs Oplon LoadBalancer and the processes Oplon Commander Decision Engine
-
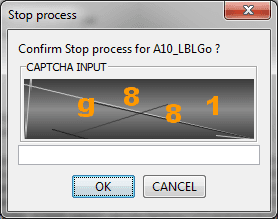
CAPTHCA INPUT (decrease human error Slips)
Confirmation through CAPTCHA INPUT was introduced for all potentially dangerous operations to decrease the possibility of human error. Confirmation through this feature in all critical operations allows to significantly decrease human error derived from action automation (see definitions of human error - Slips).
Check release and updates
At the start of the Oplon Management Console processes, the release is verified at the site www.oplon.net . The data sent to the site does not contain sensitive data but only reports:
rel-99.99.99; license:127123163; IP-99999999;
-
rel: It’s the release and version of the product
-
license: is the distinctive part of the license in use
-
IP: Is a control digest
The release control is disabled by creating the “noCheckRelease” file in the installation home directory. If it is deactivated or that message cannot be sent to Oplon will not be able to provide proactive indications of security-related patches or urgent reports.
es.:
The report of the non-check is directed in (LBL_HOME)/lib/hardLogs.