DB Networked setup
Notes before installation
Oplon Application Delivery Controller is a product intended for mission-critical environments therefore only personnel who carried out the course and passed the exam is authorized to certify the installation and maintenance of the products in operation. All the certified people have an identification license issued by Oplon.
Oplon Application Delivery Controller manages the persistence of Statistics on Database Relationship in a Transactional Way. In default configuration uses the JavaDB Embedded / images engine provided directly in the Java distribution (JDK). In addition to JavaDB Embedded Oplon Application Delivery Controller was designed for use the most popular Transactional Relational Databases. Below the complete list of supported databases for storing statistics:
- Postgres
- Oracle
- MS SQLServer
- MariaDB (InnoDB engine)
- JavaDB embedded (default)
- JavaDB Networked
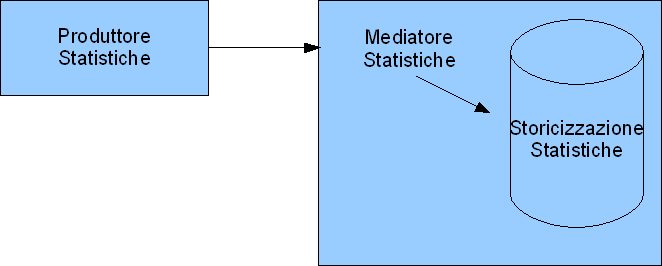
The statistics persistence module was designed to be able to be decoupled from the balancing system. This characteristic it allows the realization of different architectures according to the needs of historicization.
In the default installation these features are not immediately evident having been deliberately made so as to create minimal impact in the base installation.
Types of statistics historicization
There are basically 2 types of historicization of statistics:
-
Embedded
-
Networked
Embedded means the exclusive use of the Oplon Application Delivery Controller without the ability to interact during run-time with custom SQL queries. (N.B. It is possible switch from embedded to networked mode at any time without loss of information)
Networked means the use of a DBMS among those supported over the network with the use of drivers (JDBC) set to provision by individual manufacturers. With this type of historicization it is possible to query the Database with your own queries SQL during run-time.
Architecture
The architecture of statistical historicization was studied for have the least impact on core processing (the balance of load) while giving maximum configuration flexibility e very high scalability.
It is based on 3 logic levels

These three logical levels from a system "Process" point of view operating mode can be collapsed into Embedded mode on 2 "Process". In Networked mode, however, there will be at least 3 "Process" distinct.
Operating System Process in Embedded Mode
Since these services are reachable through the network, the architectures possible are many.
The preset architecture has a very low impact either in installation and maintenance and is well suited to those realities which only need some impromptu data to verify operations and that do not need further processing statistics or consolidated.
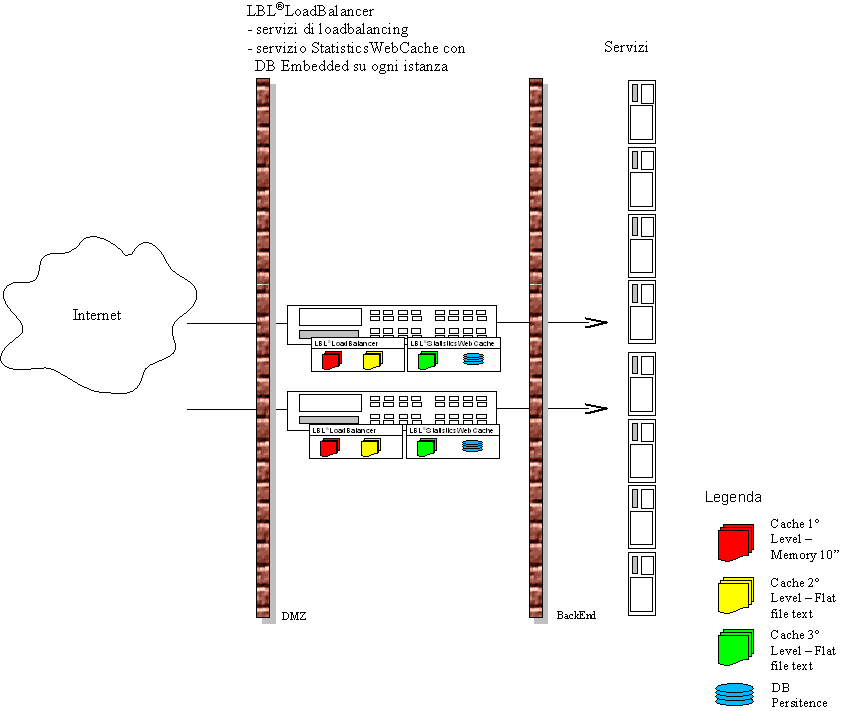
With the Embedded architecture, the statistics remain within the individual Instances and are managed automatically by the broker system (_ Oplon Application Delivery Controller WebCacheBroker _).
In the pre-set parameters the _ Oplon Application Delivery process WebCacheBroker controller _ maintains data in Embedded Database for 2 days while verifying the physical occupations in support of mass storage. In case these dimensions exceed GB (1GB) will automatically regenerate the DB avoiding the exhaustion of resources. Both the 2 day limit and the limit of 1GB can be modified by parameters (see Oplon S.A.A.I. Reference Guides).
Obviously being separate processes _ Oplon Application Delivery Controller _ (the producer of the statistics) and _ Oplon WebCacheBroker _ (the broker, Broker) and connected through the network would be anyway it is possible to delocalize the historicization on third machines, both in the same DMZ is in the backend. This possibility is certainly better exploited in the way of using a Networked Database where it will be SQL queries can be run on data from traffic.
In the image below a 3-level configuration completely separated between the production of statistics, brokerage and historicization on DBMS.
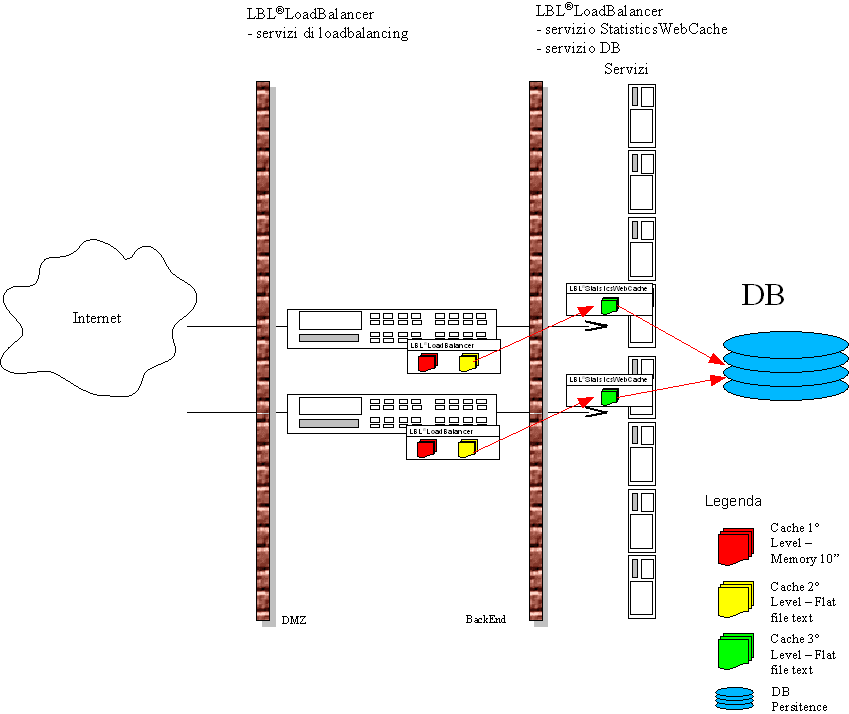
It is possible to achieve this result for two distinct reasons, the first is derived from the architectural design that is born out of three distinct ones levels, the second is derived from the logical separation of data within the same DBMS. With _ Oplon Application Delivery Controller _ Standard HA and _ Oplon Application Delivery Controller _ Enterprise HA can in fact be consolidated within it DB and in the same tables the data from multiple Instances
- Oplon Application Delivery Controller *.
Database structure and tables creation
The persistence of traffic data in the statistical database comes realized through the following tables:
-
** SESSION_ACTIVITY **
-
** analysis of session usage **
-
** L7_HTTP_HTTPS **
- persistence of HTTP and HTTPS traffic information.
-
** L4_TCP_TCPSSL **
- persistence of TCP and TCP traffic information such as SSL terminator
-
** L4_DATAGRAM **
- persistence of UDP and MULTICAST traffic information
-
** POOL_QUEUES_ACTIVITY **
- analysis of the use of request resolution pools of service
-
** INCOMING_QHIGHWATER_LEVEL **
- analysis of the use of queue filling incoming connections
-
** WAF_EXEC **
- log of the rules executed successfully by the Web Application Firewall
-
** DDOS_EXEC **
- DoS and DDoS attacks log
-
** DAILY_ALERT **
- log of notifications from Attack Prophecy
-
** GUIRT_MASTER **
- master log of the execution of the GUI Reliability Tool traces
-
** GUIRT_DETAIL **
- detail log of the execution of the steps of the GUI tracks Reliability Tool
The table schemas for each supported database are contained
in the (LBL_HOME) / legacyBin / DatabasesScript directory.
In this directory we can find respectively:
-
** ORACLE_LBLDBTables.sql **
- ORACLE database table creation
-
** SQLSERVER_LBLDBTables.sql **
- Microsoft SQL Server database table creation
-
** MySQL_LBLDBTables.sql **
- Sun MySQL database table creation
-
** POSTGRES_LBLDBTablesCreation.sql **
- Postgres database table creation
-
** JavaDB_LBLDBTables **
- Java DB derby
Apart from some differences related to the typing of the fields, tables, on different databases, contain the same data. The following pages will describe the per field in detail field the meanings of the structures in order to easily create reports, statistics, traffic-based billing systems.
SESSION_ACTIVITY table
Table containing snaps at 10 "intervals of the state of the routing sessions.
| RECORD_TYPE | Int | 6 | Record type |
| VRRP_HOST_NAME | varchar (4000) | Host name of the VRRP service. This value associated with the VRRP_PORT_NUMBER, define the balancing instance for the traffic data consolidation. If Platform Edition see Reference Guide uniqueContextID parameter in iproxy.xml | |
| VRRP_PORT_NUMBER | int | Port number of the VRRP service. This value associated with the VRRP_HOST_NAME, define the balancing instance for the traffic data consolidation | |
| END_POINTS_GROUPING | varchar (4000) | This is the name of the endpoint group | |
| DOMAIN_REQUEST | varchar (4000) | This is the domain associated with the session | |
| COMMAND | varchar (4000) | EMPTY | |
| URI_PATH_REQUEST | varchar (4000) | EMPTY | |
| RESPONSE_CODE | int | 0 | |
| END_POINT_HOST_NAME | varchar (4000) | Host name of the endpoint associated with the session | |
| END_POINT_PORT_NUMBER | int | Port number of the host of the endpoint associated with the session | |
| END_POINT_URI_PATH | varchar (4000) | This is the URIPath of the context being processed | |
| USER_ID | varchar (4000) | Future use | |
| CLIENT_ADDRESS | varchar (4000) | The client address reports the address of the client that requested the service. e.g. 192.168.43.150 If transmission to layer 7 HTTP / S and the management of the X-Forwarded-For entity (HTTP HEADER) has been set through the parameter xForwardedFor = "true" in the listener in iproxy.xml the value of the entire IP chain will be transferred. Obviously OPLON can only ensure the last element of the chain as the other elements are only useful for statistical purposes being populated by other tools infrastructure such as proxies. e.g .: 192.168.32.115,192.168.41.10,192.168.43.150 | |
| THIS_DATE | date | Date standardized at 00:00:00 | |
| THIS_TIME | time | Time with date uniform 01-01-1970 | |
| NUMBER_OF_ACTIVE_SESSIONS | int | It is the number of sessions related to the grouping key (in red) |
The keys used are:
`` index K1_L7_HTTP_HTTPS ON L7_HTTP_HTTPS (THIS_DATE);
index K2_L7_HTTP_HTTPS ON L7_HTTP_HTTPS (THIS_TIME); ``
Table L7_HTTP_HTTPS
This table contains HTTP and HTTPS (SSL) protocol traffic.
| RECORD_TYPE | Int | 0 = HTTP 1 = HTTPS | Record type |
| VRRP_HOST_NAME | varchar (4000) | Host name of the VRRP service. This value associated with the VRRP_PORT_NUMBER, define the balancing instance for the traffic data consolidation. If Platform Edition see Reference Guide uniqueContextID parameter in iproxy.xml | |
| VRRP_PORT_NUMBER | int | Port number of the VRRP service. This value associated to the VRRP_HOST_NAME, define the balancing instance for the traffic data consolidation | |
| END_POINTS_GROUPING | varchar (4000) | This is the name of the endpoint group | |
| DOMAIN_REQUEST | varchar (4000) | This is the domain requested by the client | |
| COMMAND | varchar (4000) | It is the HTTP command requested by the client (GET, POST, etc) | |
| URI_PATH_REQUEST | varchar (4000) | Path referring to the domain requested by the client. This value reports the result of the request after the rewriting action if it exists. It is the actual request that is made in the backend. | |
| URI_PATH_REQUEST_ORG | varchar (4000) | Original path referring to the domain requested by the client before any rewriting | |
| CONTENT_TYPE_REQUEST | varchar (4000) | content type in request | |
| CONTENT_TYPE_RESPONSE | varchar (4000) | content type in response | |
| RESPONSE_CODE | int | Response CODE HTTP sent by the server to the client in response to its request | |
| END_POINT_HOST_NAME | varchar (4000) | Name of the host on which the service request was processed | |
| END_POINT_PORT_NUMBER | int | Port number of the host on which the service request was processed | |
| END_POINT_URI_PATH | varchar (4000) | This is the context URL path on which the request was processed | |
| USER_ID | varchar (4000) | The column contains the information of the profiled and authenticated user. The information is a sum of the characteristic elements of a BASIC authentication (Basic Authentication) and of the authorization deriving from a digital certificate. This column contains respectively: If authorization with digital certificate, the Subject with an additional value bearing the Serial Number of the certificate eg: "CN = clientname, OU = clientlob, O = clientcompany, L = clientcountry, ST = clientdistrict, C = IT, SERIAL = 1282479557" If basic authentication “BASIC = usr1” If both credentials are present, the resulting value will be: "BASIC = usr1, CN = clientname, OU = clientlob, O = clientcompany, L = clientcountry, ST = clientdistrict, C = IT, SERIAL = 1282479557" | |
| CLIENT_ADDRESS | varchar (4000) | The client address reports the address of the client that requested the service. e.g. 192.168.43.150 If transmission to layer 7 HTTP / S and the management of the X-Forwarded-For entity (HTTP HEADER) has been set through the parameter xForwardedFor = "true" in the listener in iproxy.xml the value of the entire IP chain will be transferred. Obviously OPLON can only ensure the last element of the chain as the other elements are only useful for statistical purposes being populated by other tools infrastructure such as proxies. eg .: 192.168.32.115,192.168.41.10,192.168.43.150 | |
| USER_AGENT | varchar (4000) | User-agent value in the HTTP HEADER | |
| COOKIES | varchar (4000) | Cookie value in the HTTP HEADER | |
| REFERER | varchar (4000) | Referer value in the HTTP HEADER | |
| URI_PARAMETERS | varchar (4000) | Parameterized value and / or query string. The parameters, defined in the URL by the character; and the query strings defined give character? are normalized to a single value separated by & amp ;. eg .: / aaa / bbb; c1 = aaa & amp; c2 = bbb? q1 = ccc & amp; q2 = dddd VALUE IN URI_PARAMETERS c1=aaa&c2=bbb&q1=ccc&q2=dddd | |
| PROTOCOL_VERSION | varchar (4000) | HTTP / 1.0 HTTP / 1.1 | |
| INCOMING_ADDRESS | varchar (4000) | Local address where the connection was accepted | |
| INCOMING_PORT_NUMBER | int | Local port where the connection was accepted | |
| THIS_DATE | date | Date standardized at 00:00:00 | |
| THIS_TIME | time | Time with date uniform 01-01-1970 | |
| COUNTER | bigint | Number of operations summed in this record (if the defaults have not been changed it is the number of operations performed in its time window in the last 10 ") | |
| RESPONSE_TIME | bigint | It is the response time of the requested service (This value is relative to the traffic of the last 10 ". To have an average value it is necessary to divide it by the COUNTER). Value expressed in nanoseconds. | |
| LAP_TIME_A | bigint | Time between the end of the reading of the client HEADER and the beginning of the connection towards the endpoint (This value is relative to the traffic of the last 10 ". To have an average value it is necessary to divide it by the COUNTER). Value expressed in nanoseconds. | |
| LAP_TIME_B | bigint | Connection time to the endpoint (This value is relative to the traffic of the last 10 ". To have an average value it is necessary to divide it by the COUNTER). Value expressed in nanoseconds. | |
| LAP_TIME_C | bigint | Time between the connection made to the endpoint and the beginning of the reading of the response HEADER. If the client sends the body it is the transmission time of the body from the client to the endpoint. (This value is relative to the traffic of the last 10 ". To have an average value it is necessary to divide it by the COUNTER). Value expressed in nanoseconds. | |
| LAP_TIME_D | bigint | Read time of the endpoint Header (This value is relative to the traffic of the last 10 ". To get an average value it is necessary to divide it by the COUNTER). Value expressed in nanoseconds. | |
| LAP_TIME_E | bigint | Time between the end of the Header reading and the end of the data in response (This value is relative to the traffic of the last 10 ". To have an average value it is necessary to divide it by the COUNTER). Value expressed in nanoseconds. | |
| HEADER_LENGTH_FROM_CLIENT | bigint | It is the length of the client request HEADER to the endpoints (This value is relative to the traffic of the last 10 ". To get an average value it is necessary to divide it by the COUNTER) | |
| BYTES_SENT_FROM_CLIENT | bigint | Total transferred including the HEADER from the client to the endpoints (This value is relative to the traffic of the last 10 ". To have an average value it is necessary to divide it by the COUNTER) | |
| HEADER_LENGTH_FROM_END_POINT | bigint | It is the length of the response HEADER of the endpoints towards the clients (This value is relative to the traffic of the last 10 ". To have an average value it is necessary to divide it by the COUNTER) | |
| BYTES_SENT_FROM_END_POINT | bigint | Total transferred including the HEADER from the endpoints to the clients (This value is relative to the traffic of the last 10 ". To have an average value it is necessary to divide it by the COUNTER) relative to the grouping key (in red) | |
| SESSIONID | varchar (100) | It is a unique identifier (hash) generated by the set of client address + referer | |
| REFERRING_DOMAIN | varchar (300) | Host name from which the request originated | |
| BROWSER | varchar (100) | Name of the browser or client that made the request | |
| BROWSER_REL | varchar (100) | Release of the browser or client that made the request | |
| OS | varchar (100) | Operating system from which the request was received | |
| OS_REL | varchar (100) | Release of the operating system from which the request was received | |
| DEVICE | varchar (100) | Manufacturer of the device from which the request was received | |
| COUNTRY_CODE | varchar (100) | Initials of the state from which the request was received | |
| COUNTRY_DES | varchar (350) | Description of the state from which the request came | |
| INTERNET_ADDRESS | varchar (350) | Is the socket-derived client address if XFF does not exist. If XFF exists, it is the second in the XFF chain. |
The keys used are:
index K1_L7_HTTP_HTTPS ON L7_HTTP_HTTPS (THIS_DATE);

index K2_L7_HTTP_HTTPS ON L7_HTTP_HTTPS (THIS_TIME);
Table L4_TCP_TCPSSL
As for the previous table, this table contains the data of traffic related to TCP and TCP connector activities such as SSL terminator. The initial structure is very similar to the HTTP / S one to then differentiate on traffic data
| RECORD_TYPE | Int | 2 = TCP 3 = SSL | Record type |
| VRRP_HOST_NAME | varchar (4000) | Host name of the VRRP service. This value associated with the VRRP_PORT_NUMBER, define the balancing instance for the traffic data consolidation. If Platform Edition see Reference Guide uniqueContextID parameter in iproxy.xml | |
| VRRP_PORT_NUMBER | int | Port number of the VRRP service. This value associated to the VRRP_HOST_NAME, define the balancing instance for the traffic data consolidation | |
| END_POINTS_GROUPING | varchar (4000) | This is the name of the endpoint group | |
| DOMAIN_REQUEST | varchar (4000) | If WebSocket is the required host at layer 7 | |
| COMMAND | varchar (4000) | Identifies the data flow: CLIENT_FLOW from client to endpoints ENDPOINT_FLOW from endpoints to clients WebSocket:WSCLIENT_FLOW from client to endpoints WSENDPOINT_FLOW from endpoints to clients | |
| URI_PATH_REQUEST | varchar (4000) | If WebSocket is the requested URL Path at layer 7 | |
| RESPONSE_CODE | int | 0 | |
| END_POINT_HOST_NAME | varchar (4000) | Name of the host on which the service request was processed | |
| END_POINT_PORT_NUMBER | int | Port number of the host on which the service request was processed | |
| END_POINT_URI_PATH | varchar (4000) | If WebSocket is the requested URL Path at layer 7 | |
| USER_ID | varchar (4000) | If a SSL client authentication contains the Subject and the additional values of the certificate bearing the Serial Number eg .: "CN = clientname, OU = clientlob, O = clientcompany, L = clientcountry, ST = clientdistrict, C = IT, SERIAL = 1282479557" | |
| CLIENT_ADDRESS | varchar (4000) | The client address reports the address of the client that requested the service. e.g. 192.168.43.150 | |
| COOKIES | varchar (4000) | Unique value associated with the connection. This value is populated with the LBLCOLOR value to identify the single connection at layer 4. To activate the population of this value it is necessary to set the parameter distinguishSingleConnection = "true" in the & lt; bind & gt; paragraph of the iproxy.xml parameter file If WebSocket contains HTTP / S layer 7 connection cookies | |
| INCOMING_ADDRESS | varchar (4000) | Local address where the connection was accepted | |
| INCOMING_PORT_NUMBER | int | Local port where the connection was accepted | |
| THIS_DATE | date | Date standardized at 00:00:00 | |
| THIS_TIME | time | Time with date uniform 01-01-1970 | |
| COUNTER | bigint | Number of operations summed in this record (if the defaults have not been changed it is the number of operations performed in its time window in the last 10 ") | |
| BYTES_FORWARDED | bigint | It is the number of bytes exchanged based on the flow (client & gt; endpoint or endpoint & gt; client) related to the grouping key (in red) | |
| START_ADV_TIME | bigint | This is the moment when the first buffer / character expressed in nanoseconds is detected | |
| END_ADV_TIME | bigint | This is when the last buffer of the stream is flushed in nanoseconds | |
| TOTAL_ADV_TIME | bigint | It is the total information forwarding time (END_ADV_TIME - START_ADV_TIME) expressed in nanoseconds |
The keys used are:
`` index K1_L4_TCP_TCPSSL ON L4_TCP_TCPSSL (THIS_DATE);
index K2_L4_TCP_TCPSSL ON L4_TCP_TCPSSL (THIS_TIME); ``
Table L4_DATAGRAM
As for the previous table, this table contains the data of traffic related to TCP and TCP connector activities such as SSL terminator. The initial structure is very similar to the HTTP / S one to then differentiate on traffic data
| RECORD_TYPE | Int | 10 = UDP 11 = MULTICAST | Record type |
| VRRP_HOST_NAME | varchar (4000) | Host name of the VRRP service. This value associated with the VRRP_PORT_NUMBER, define the balancing instance for the traffic data consolidation. If Platform Edition see Reference Guide uniqueContextID parameter in iproxy.xml | |
| VRRP_PORT_NUMBER | int | Port number of the VRRP service. This value associated with the VRRP_HOST_NAME, define the balancing instance for the traffic data consolidation | |
| END_POINTS_GROUPING | varchar (4000) | This is the name of the endpoint group | |
| DOMAIN_REQUEST | varchar (4000) | EMPTY | |
| COMMAND | varchar (4000) | Identifies the flow of data CLIENT_FLOW from client to endpoints ENDPOINT_FLOW from endpoints to clients | |
| URI_PATH_REQUEST | varchar (4000) | EMPTY | |
| RESPONSE_CODE | int | 0 | |
| END_POINT_HOST_NAME | varchar (4000) | Name of the host on which the service request was processed | |
| END_POINT_PORT_NUMBER | int | Port number of the host on which the service request was processed | |
| END_POINT_URI_PATH | varchar (4000) | EMPTY | |
| USER_ID | varchar (4000) | Future use | |
| CLIENT_ADDRESS | varchar (4000) | The client address reports the address of the client that requested the service. e.g. 192.168.43.150 | |
| INCOMING_ADDRESS | varchar (4000) | Local address where the connection was accepted | |
| INCOMING_PORT_NUMBER | int | Local port where the connection was accepted | |
| THIS_DATE | date | Date standardized at 00:00:00 | |
| THIS_TIME | time | Time with date uniform 01-01-1970 | |
| COUNTER | bigint | Number of operations summed in this record (if the defaults have not been changed it is the number of operations performed in its time window in the last 10 ") | |
| BYTES_FORWARDED | bigint | This is the number of bytes exchanged |
The keys used are:
`` index K1_L4_DATAGRAM ON L4_DATAGRAM (THIS_DATE);
index K2_L4_DATAGRAM ON L4_DATAGRAM (THIS_TIME); ``
POOL_QUEUES_ACTIVITY table
This table contains a 10 "snap of the activity status protocol solvers. Its interpretation cannot be usable as a summation of the day's activities but as data instant statistic in the moment relative to the date and time reported on the records. With these snaps you can stake out on an axis the state of activity and therefore the utilization peaks with a slice of 10 ".
This table contains two types of snaps, one related to the state of activity of protocol solvers and the other related to the state of "committed" protocol resolvers.
| RECORD_TYPE | Int | 4 = ACTIVITY 5 = COMMITTED | Record type |
| VRRP_HOST_NAME | varchar (4000) | Host name of the VRRP service. This value associated with the VRRP_PORT_NUMBER, define the balancing instance for the traffic data consolidation. If Platform Edition see Reference Guide uniqueContextID parameter in iproxy.xml | |
| VRRP_PORT_NUMBER | int | Port number of the VRRP service. This value associated with the VRRP_HOST_NAME, define the balancing instance for the traffic data consolidation | |
| END_POINTS_GROUPING | varchar (4000) | This is the name of the endpoint group | |
| DOMAIN_REQUEST | varchar (4000) | This is the domain being processed on the solver | |
| COMMAND | varchar (4000) | EMPTY | |
| URI_PATH_REQUEST | varchar (4000) | EMPTY | |
| RESPONSE_CODE | int | 0 | |
| END_POINT_HOST_NAME | varchar (4000) | Name of the host on which the service request was processed | |
| END_POINT_PORT_NUMBER | int | Port number of the host on which the service request was processed | |
| END_POINT_URI_PATH | varchar (4000) | This is the URIPath of the context being processed | |
| USER_ID | varchar (4000) | Future use | |
| CLIENT_ADDRESS | varchar (4000) | The client address reports the address of the client that requested the service. e.g. 192.168.43.150 If transmission to layer 7 HTTP / S and the management of the X-Forwarded-For entity (HTTP HEADER) has been set through the parameter xForwardedFor = "true" in the listener in iproxy.xml the value of the entire IP chain will be transferred. Obviously OPLON can only ensure the last element of the chain as the other elements are only useful for statistical purposes being populated by other tools infrastructure such as proxies. eg .: 192.168.32.115,192.168.41.10,192.168.43.150 | |
| THIS_DATE | date | Date standardized at 00:00:00 | |
| THIS_TIME | time | Time with date uniform 01-01-1970 | |
| NUMBER_OF_BUSY_CONSUMER | int | It is the number of active consumers at the instant THIS_DATE and THIS_TIME relative to the grouping key (in red) |
The keys used are:
`` index K1_POOL_QUEUES_ACTIVITY ON POOL_QUEUES_ACTIVITY (THIS_DATE);
index K2_POOL_QUEUES_ACTIVITY ON POOL_QUEUES_ACTIVITY (THIS_TIME); ``
INCOMING_QHIGHWATER_LEVEL table
It is the table that records the filling level at a 10 "snap queue of incoming connection requests. This table is important because in relation to the number of protocol solvers it is the indicator of a possible DoS attack or insufficient resources for process the load of requests.
| RECORD_TYPE | Int | 7 | Record type |
| VRRP_HOST_NAME | varchar (4000) | Host name of the VRRP service. This value associated with the VRRP_PORT_NUMBER, define the balancing instance for the traffic data consolidation. If Platform Edition see Reference Guide uniqueContextID parameter in iproxy.xml | |
| VRRP_PORT_NUMBER | int | Port number of the VRRP service. This value associated with the VRRP_HOST_NAME, define the balancing instance for the traffic data consolidation | |
| THIS_DATE | date | Date standardized at 00:00:00 | |
| THIS_TIME | time | Time with date uniform 01-01-1970 | |
| HIGH_WATER | int | This is the number of connection requests in the queue before waiting to be processed | |
| HIGH_WATER_LEVEL | float | It is the calculation factor derived from: (100 * HIGH_WATER) / ACT_SESSIONS | |
| HIGH_WATER_WARNING_LEVEL | float | It is the threshold in% exceeded which a warning message is sent | |
| HIGH_WATER_DANGER_LEVEL | float | It is the threshold in% exceeded which a danger message is sent | |
| ACT_SESSIONS | int | It is the current availability of protocol resolvers | |
| MAX_CONCURRENT_SESSIONS | int | This is the maximum number of protocol resolvers |
The keys used are:
`` index K1_INCOMING_QUEUE_HL ON INCOMING_QHIGHWATER_LEVEL (THIS_DATE);
index K2_INCOMING_QUEUE_HL ON INCOMING_QHIGHWATER_LEVEL (THIS_TIME); ``
SYSLOG_EVENT table
This table collects all messages from all Oplon S.A.A.I. processes. In complex environments it is therefore a useful tool that, if centralized, can be used as a system for detect any operating anomalies.
| RECORD_TYPE | Int | 12 | Record type |
| VRRP_HOST_NAME | varchar (4000) | It is an @ separated string containing: host name @ monitor management url @ server process name @ absolute log dir @ date YYYYMMDD @ hostname_logfileSuffix | |
| VRRP_PORT_NUMBER | int | ||
| COOKIES | varchar (4000) | It is an identification value of the message that is always different and unique for each system eg: ID = "16231623" | |
| INCOMING_ADDRESS | varchar (4000) | Host name | |
| THIS_DATE | date | Date standardized at 00:00:00 | |
| THIS_TIME | time | Time with date uniform 01-01-1970 | |
| REPETITIONS | bigint | Number of repetitions of the same message | |
| TIME_SEQUENCE | bigint | Event timeline | |
| SEVERITY | varchar (4000) | ERROR | WARNING | DEBUG | FATAL | |
| JAVA_REL | varchar (4000) | Release java | |
| LBL_REL | varchar (4000) | Release LBL | |
| MESSAGE_GRP | varchar (4000) | Name of the processing unit that generated the message |
| HOST_ID | varchar (4000) | Name of the host that generated the message | |
| MESSAGE | varchar (4000) | Message | |
| MONITOR_MNG_URL | varchar (4000) | ||
| MONITOR_PROCESS_NAME | varchar (4000) |
The keys used are:
index K1_SYSLOG_EVENT ON SYSLOG_EVENT (THIS_DATE);

index K2_SYSLOG_EVENT ON SYSLOG_EVENT (THIS_TIME);
NOTE: At the start of the Monitor, the column is set with
MONITOR*MNG_URL * * UNDEFINED _ * because he still has not been
started in-house theater management. Immediately after the start this
column will correctly report the value of management eg.:
https://192.168.46.109:54443/WebRegister
NOTE1: For the Monitor process the MONITOR_PROCESS_NAME is set with **MONITOR **
WAF_EXEC table
If Web Application Firewall is installed, this table collects the log of all rules successfully executed during the passage of data.
| RECORD_TYPE | Int | 14 | Record type |
| VRRP_HOST_NAME | varchar (350) | Host name of the VRRP service. This value associated with the VRRP_PORT_NUMBER, define the balancing instance for the traffic data consolidation. If Platform Edition see Reference Guide uniqueContextID parameter in iproxy.xml | |
| VRRP_PORT_NUMBER | int | Port number of the VRRP service. This value associated with the VRRP_HOST_NAME, define the balancing instance for the traffic data consolidation | |
| DOMAIN_REQUEST | varchar (3500) | If WebSocket is the required host at layer 7 | |
| CLIENT_ADDRESS | varchar (3500) | The client address reports the address of the client that requested the service. e.g. 192.168.43.150 | |
| THIS_DATE | date | Date standardized at 00:00:00 | |
| THIS_TIME | time | Time with date uniform 01-01-1970 | |
| COUNTER | int | Number of operations summed in this record (if the defaults have not been changed it is the number of operations performed in its time window in the last 10 ") | |
| RULE_ID | varchar (100) | unique name of the rule | |
| REQUEST_ID | varchar (100) | ||
| ENABLE | varchar (100) | Type of enabling the rule: on, off, detect | |
| SCORE | int | Weight of the rule |
| ACTION | varchar (100) | Type of action taken: drop, blacklist_ip ... |
| DESCRIPTION | varchar (3500) | Description of the rule |
| EXECUTION_QUEUE | varchar (100) | runtime / near time |
| CATEGORY | varchar (100) | Rule category: Input; Bruteforce; Probing; Info leakage; Authentication; Linked site… |
The keys used are:
create index K1_WAF_EXEC ON WAF_EXEC (THIS_DATE);

create index K2_WAF_EXEC ON WAF_EXEC (THIS_TIME);
DDOS_EXEC table
If Web Application Firewall is installed, this table collects the log of all rules successfully executed during the passage of data.
| RECORD_TYPE | Int | 15 | Record type |
| VRRP_HOST_NAME | varchar (350) | Host name of the VRRP service. This value associated with the VRRP_PORT_NUMBER, define the balancing instance for the traffic data consolidation. If Platform Edition see Reference Guide uniqueContextID parameter in iproxy.xml | |
| VRRP_PORT_NUMBER | int | Port number of the VRRP service. This value associated with the VRRP_HOST_NAME, define the balancing instance for the traffic data consolidation | |
| DOMAIN_REQUEST | varchar (3500) | If WebSocket is the required host at layer 7 | |
| INCOMING_ADDRESS | varchar (3500) | Local address where the connection was accepted | |
| CLIENT_ADDRESS | varchar (3500) | The client address reports the address of the client that requested the service. e.g. 192.168.43.150 | |
| THIS_DATE | date | Date standardized at 00:00:00 | |
| THIS_TIME | time | Time with date uniform 01-01-1970 | |
| COUNTER | int | Number of operations summed in this record (if the defaults have not been changed it is the number of operations performed in its time window in the last 10 ") | |
| TUNNELS | int | unique name of the rule | |
| QUARANTINE_TIME | bigint | Quarantine time | |
| QUARANTINE_START_TIME | datetime | Quarantine start | |
| QUARANTINE_END_TIME | datetime | End of quarantine | |
| COUNTRY_CODE | varchar (100) | Country code of the attack |
| COUNTRY | varchar (100) | Extended Country | |
| SUBNET | int | 1 if attack from a subnet; 0 if coming from single IP | |
| DETECT | int | 1 if detected without action (detect only); 0 if mitigation action performed |
The keys used are:
create index K1_DDOS_EXEC ON DDOS_EXEC (THIS_DATE);

create index K2_DDOS_EXEC ON DDOS_EXEC (THIS_TIME);
DAILY_ALERT table
If Web Application Firewall and Attack Prophecy are installed, this table collects the daily notifications of Attack Prophecy.
| THIS_DATE | date | Date standardized at 00:00:00 |
| CLIENT_ADDRESS | varchar (100) | The client address reports the address of the client that requested the service. e.g. 192.168.43.150 |
| COUNTRY_CODE | varchar (100) | Country code of the attack |
| COUNTRY_DES | varchar (350) | Country extended |
| AS_CODE | varchar (100) | Autonomous system code |
| AS_DESC | varchar (350) | Description of autonomous system |
| CATEGORY | varchar (100) | Rule category: Input; Bruteforce; Probing; Info leakage; Authentication; Linked site… |
| ALERT_NUM | int | Number of alerts |
The keys used are:
create index K1_DAILY_ALERT ON DAILY_ALERT (THIS_DATE);
Tabella GUIRT_MASTER GUIRT_DETAIL
The two tables GUIRT_MASTER and GUIRT_DETAIL are populated by the module GUI Reliability Tool while running. These two tables are correlated in one to many through the PLAY-ID join.
| GUIRT_MASTER | |||
| PLAY_ID | bigint | Unique id of execution of the trace (Join with PLAY_ID of GUIRT_DETAIL) | |
| HOST_ID | varchar (512) | OPLON GDG (Where) node identifier | |
| PROCESS_NAME | varchar (512) | Module name (e.g .: G10_LBLGUIPlayer) | |
| TRACK_ID | varchar (512) | Track name assigned in the player loading form | |
| START_TIME | datetime | Trace execution start date time | |
| END_TIME | datetime | End date time for trace execution | |
| ERROR | int | 0 the trace did not end with an error, 1 the trace ended with an error |
| GUIRT_DETAIL | ||
| PLAY_ID | bigint | Unique id of execution of the trace (Join with PLAY_ID of GUIRT_MASTER) |
| TIME_SEQ | bigint | This is the timeline of the step. NOTE: The steps can be executed conditionally and therefore the history of the step number can be different from the sequence. |
| STYPE | int | Type of step: 0 = process step, 1 = text test 2 = image test, 3 = end step |
| ERROR | int | 0 the trace did not end in error, 1 the trace ended in error. NOTE: It may happen that a step detects an error but it is corrected by a conditional jump. In this case the step will have as ERROR 1 while the track will have as ERROR 0 |
| ORIGINAL_SEQ | int | Trace start date time |
| ROW_NUM | int | If a replacement "csv" list has been assigned to the running track, this is the row number of the running list. |
| ROW_COMPUTETIME | bigint | Time taken by the system to perform the operation (example time to appear image or to search for a text) |
| ROW_TIME | bigint | Total gross time taken to perform the step in milliseconds. This time includes the ROW_COMPUTETIME calculation time which must be separated if you want to estimate the net waiting time |
| MESSAGE | varchar (2000) | Total message |
| RECORDED | varchar (2000) | Loaded only if error. If TEXT type test contains the registered value to compare. If image type test contains the name of the file with the recorded image for comparison. |
| PICKED | varchar (2000) | Only loaded if error. If TEXT type test contains the detected value. If image type test contains the name of the file with the detected image. NOTE: Upon detection of the error, 3 images are sent to the system: recorded image, detected image and desktop snap. |
Selection example with Join GUIRT_MASTER and GUIRT_DETAIL to detect all the image comparison steps that have encountered an error of comparison.
SELECT  * from GUIRT_MASTER m

LEFT JOIN GUIRT_DETAIL d ON m.PLAY_ID = d.PLAY_ID

WHERE d.STYPE < >3 and m.ERROR=1 and d.ERROR=1 and STYPE=2

ORDER BY m.START_TIME, m.PLAY_ID, d.TIME_SEQ;
Le immagini vengono trasferite verso il broker che provvede a memorizzarle nella directory: (LBL_HOME)/ GUIRTImages/
Il nome del file è composto dal PLAY_ID, sequenza temporale, tipo di immagine: picked, recorded, desktop.
882208199_1534915217334_picked.png

882208199_1534915217334_recorded.png

882208199_1534915217380_desktop.png
Form stop
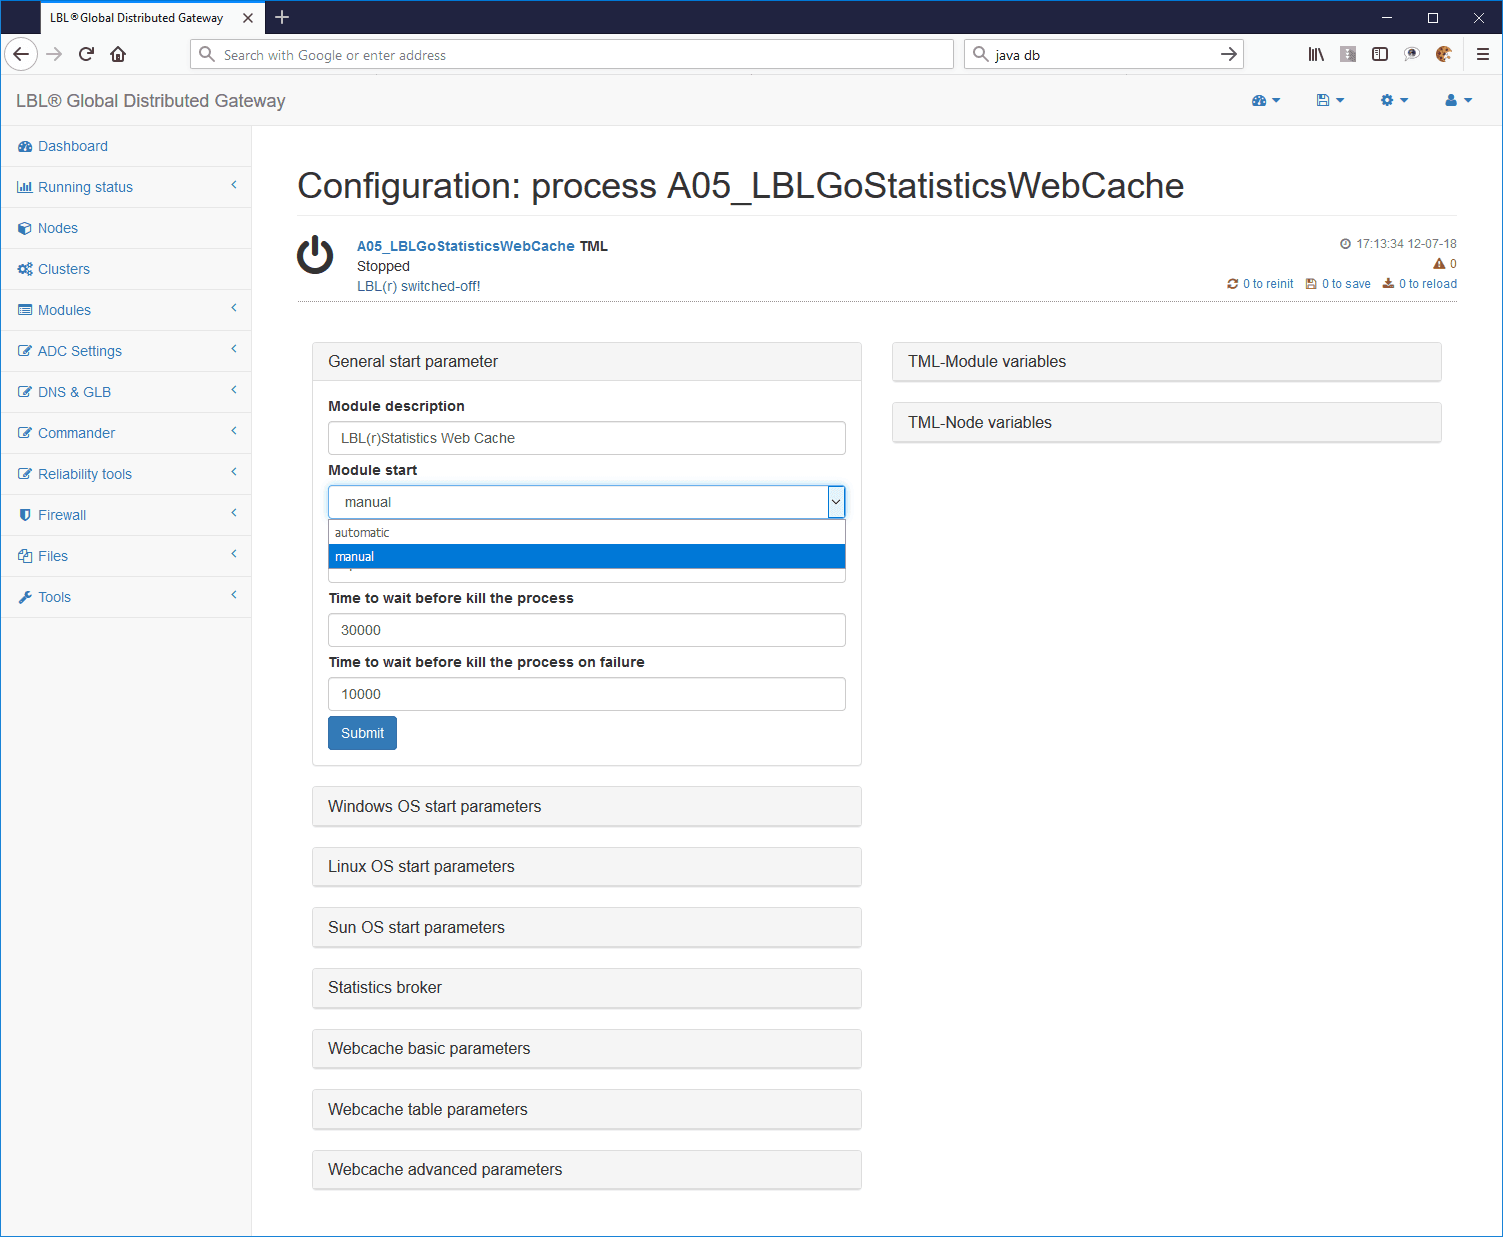
Before modifying the parameters, stop the module concerned.
Modules> Statistic brokers> Choose the module> Edit
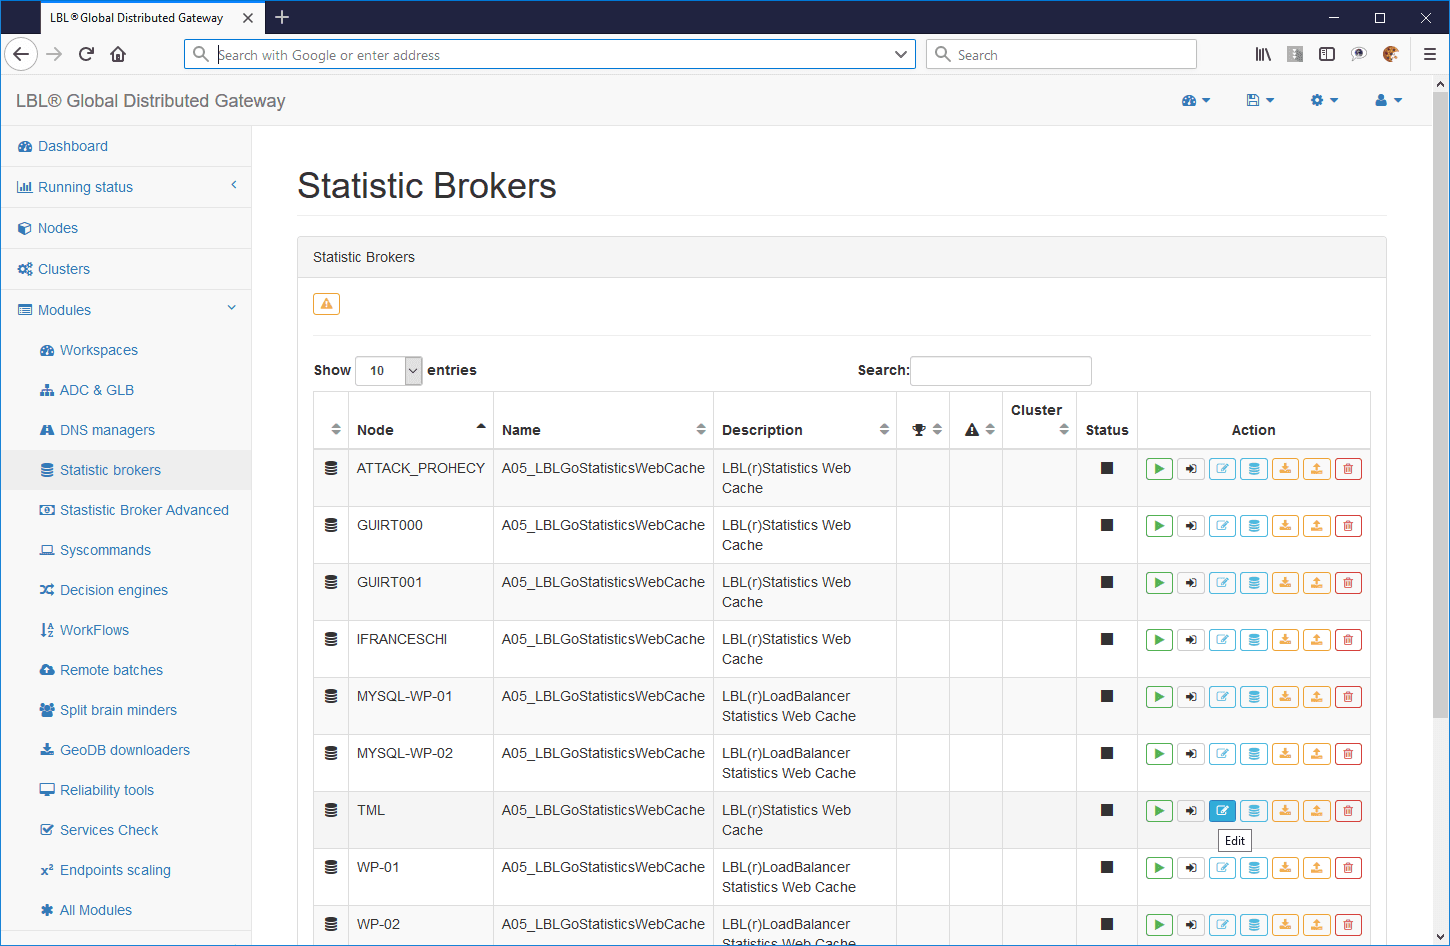
Expand the General start parameters panel> Set Module start from automatic to manual
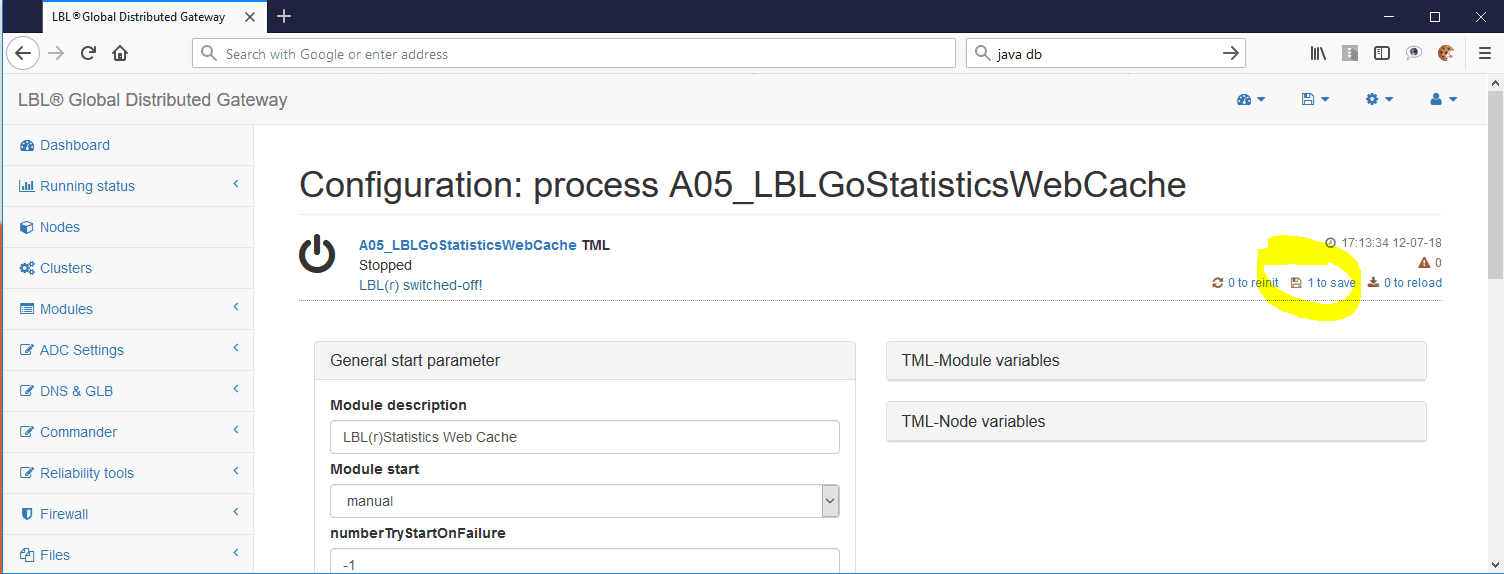 Save the ed parameters
wait for the module to be in Stopped state:
Save the ed parameters
wait for the module to be in Stopped state:
Upload database connection libraries
To load the database libraries run:
Files> External libraries> Import> Choose the form> Browse> Confirm
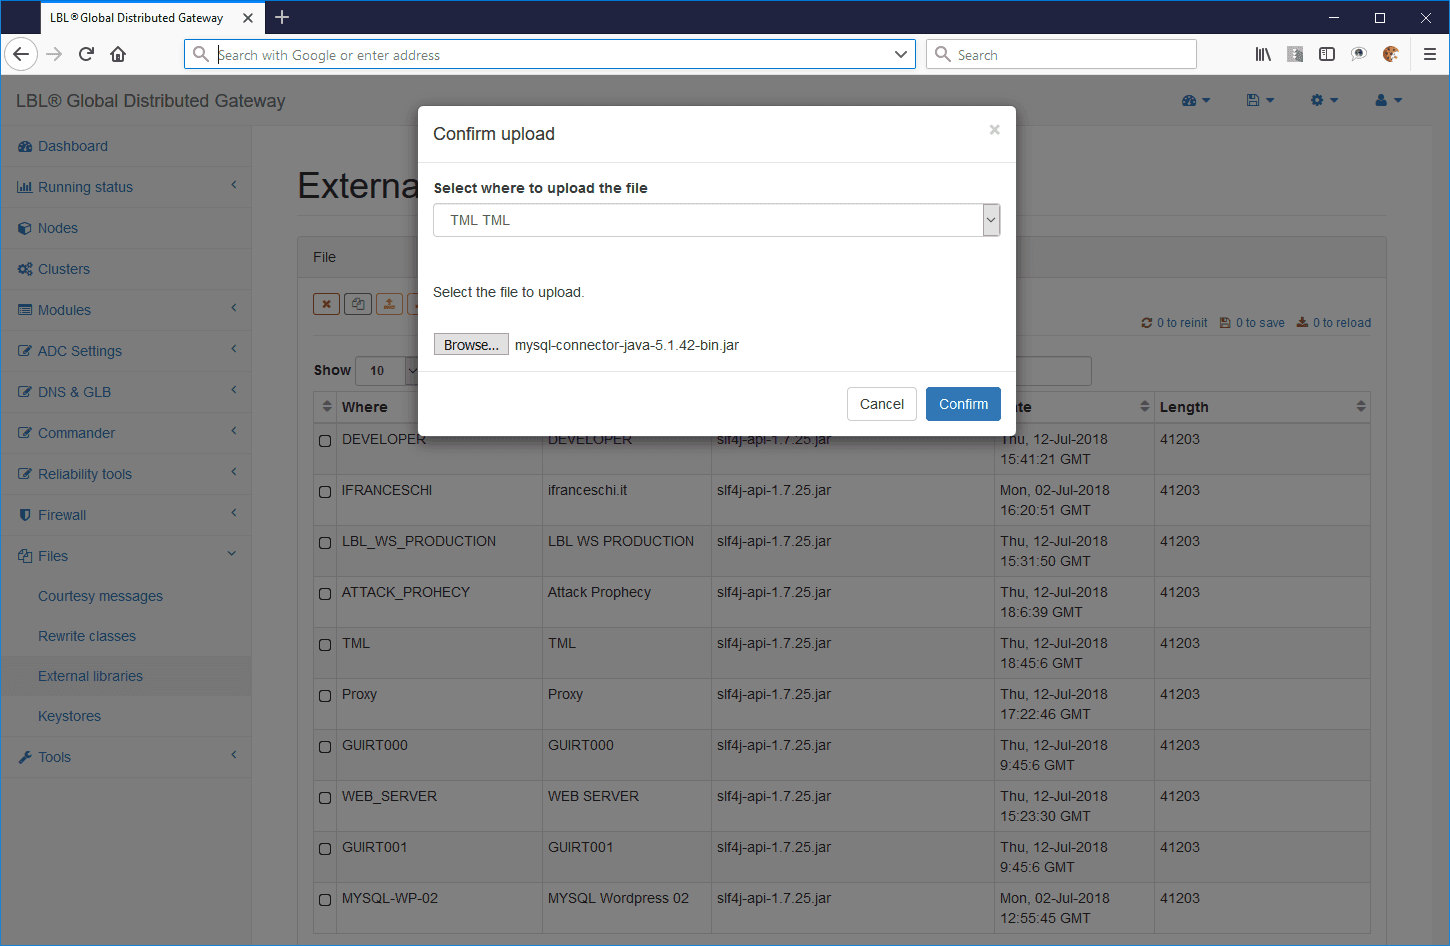
Upon confirmation, the library will be loaded into the selected node. Self more library files needed repeat the operation for all files.
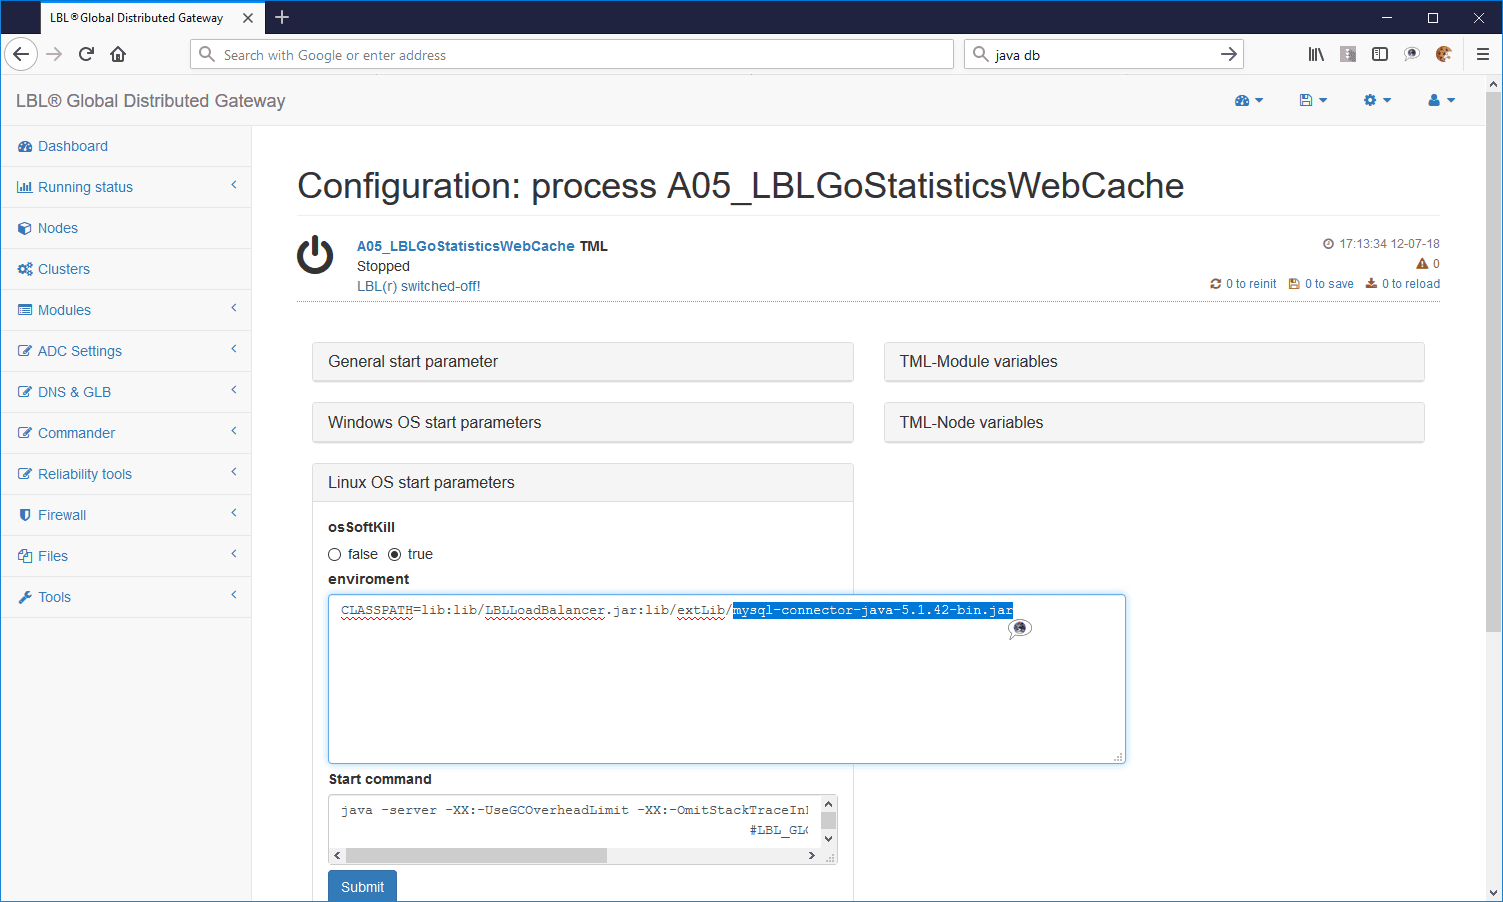
Associating the library with the module
To associate the database library with the module that connects to the database execute:
Modules> Statistic brokers> Choose the module> Edit
Choose the affected Operating System panel and change the class path with the database library (s). In this example with the MySQL library.
Connection to the DB
To set the DB connection parameters, depending on the type of DB execute:
Modules> Statistic brokers> Choose the
module> Edit
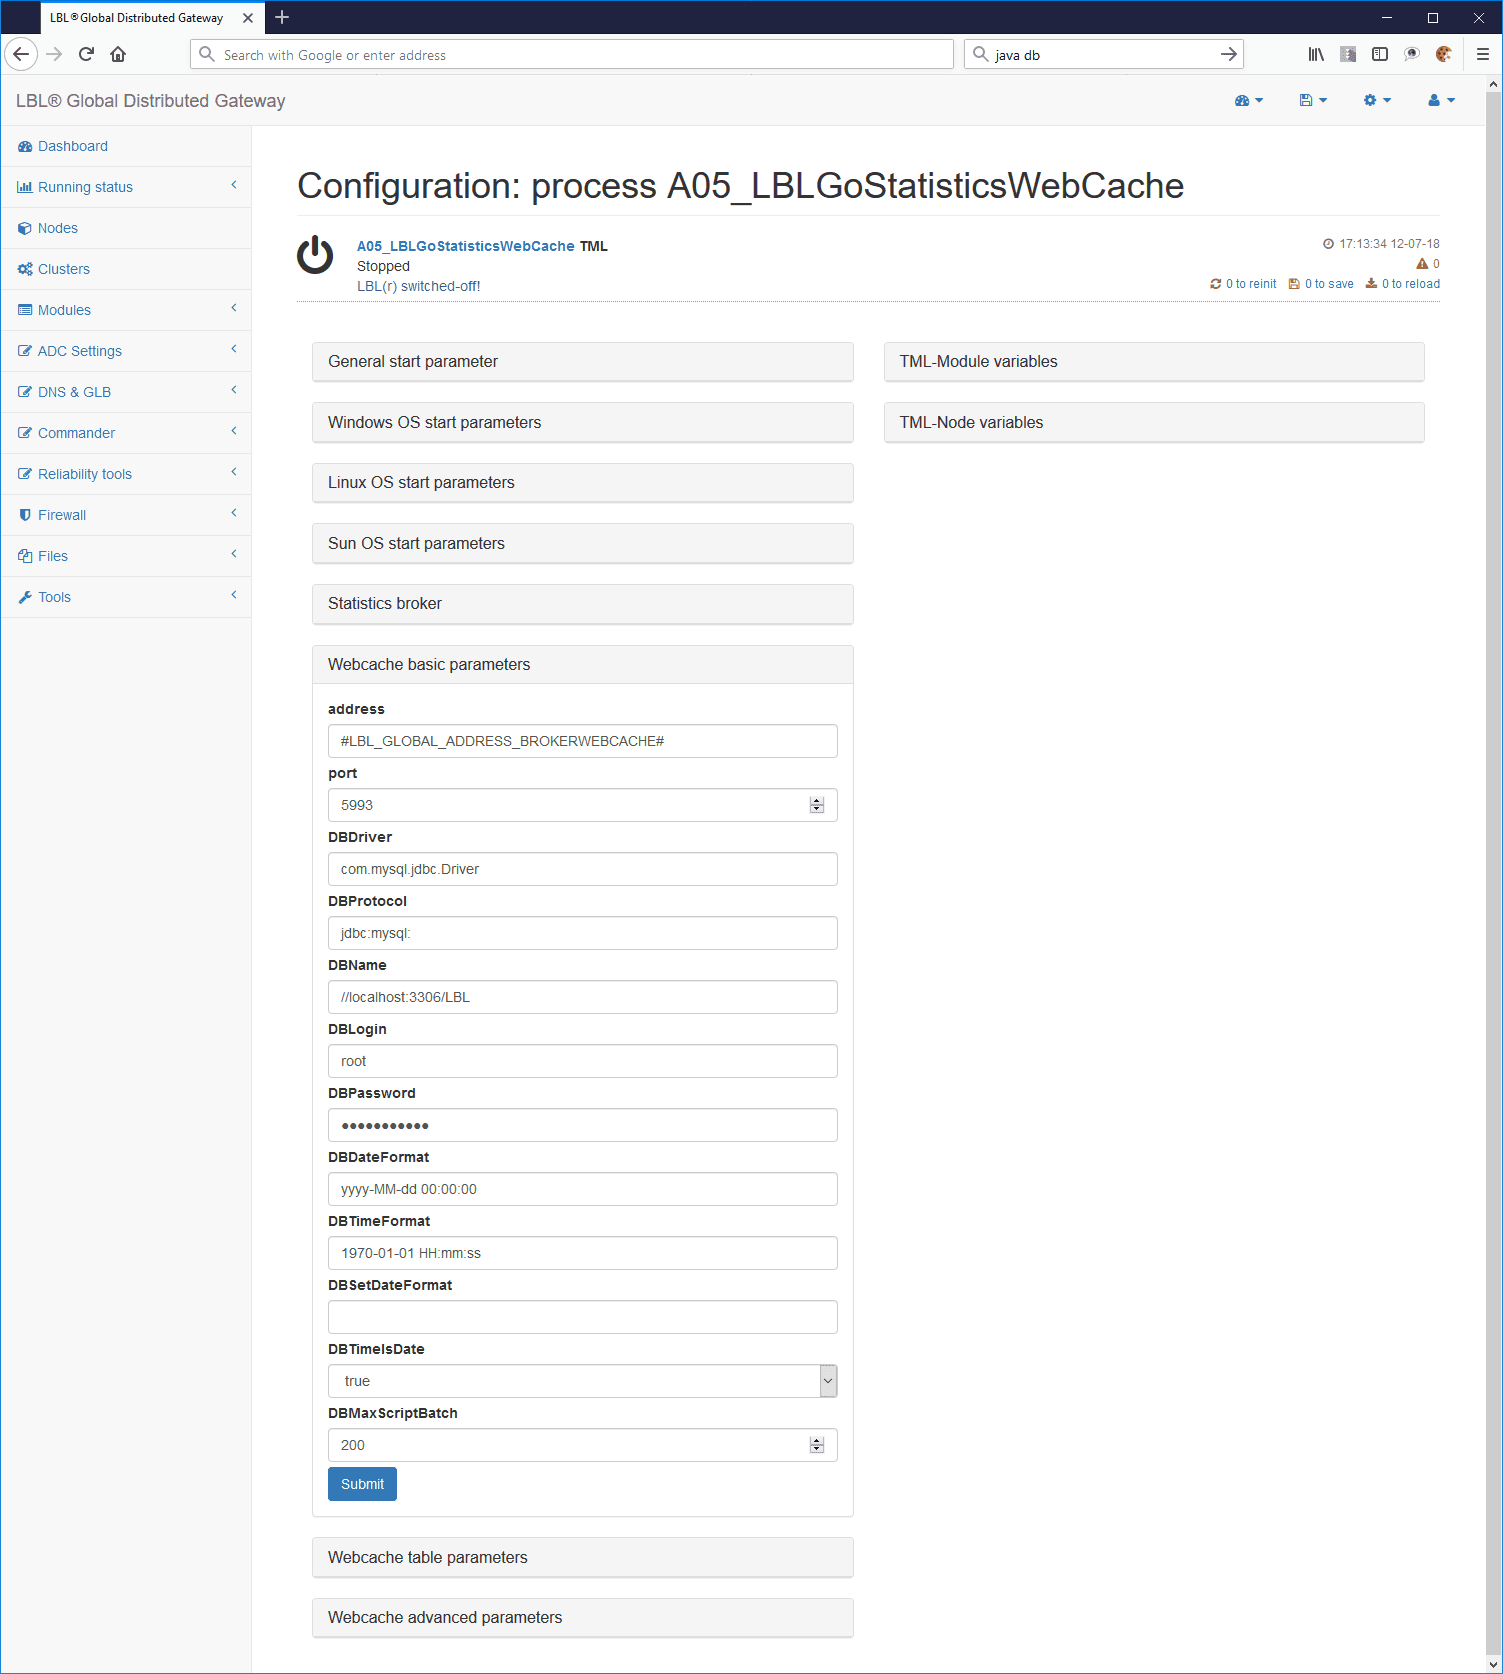 Expand the Webcache basic panel
parameter and set the parameters according to the DB used.
Expand the Webcache basic panel
parameter and set the parameters according to the DB used.
The list of parameters depending on the DB is shown below.
DERBY EMBEDDED(es. library: derby.jar derbyclient.jar derbytools.jar)
DBDriver= "org.apache.derby.jdbc.EmbeddedDriver "
DBProtocol= "jdbc:derby: "
DBName= "lib/LBLDBStatistics "
DBDateFormat= "yyyy-MM-dd "
DBTimeFormat= "HH:mm:ss "
DERBY NETWORKED (es. library: derby.jar derbyclient.jar derbytools.jar)
DBDriver="org.apache.derby.jdbc.ClientDriver"
DBProtocol="jdbc:derby:"
DBName="//\_\_\_hostname\_\_\_:\_\_\_portnumber\_\_\_/\_\_\_\_directoryDBName\_\_\_"
DBDateFormat="yyyy-MM-dd"
DBTimeFormat="HH:mm:ss"
MySQL (es. library: mysql-connector-java-5.1.10-bin.jar)
DBDriver="com.mysql.jdbc.Driver"
DBProtocol="jdbc:mysql:"
DBName="//\_\_\_hostname\_\_\_:\_\_\_portnumber\_\_\_/\_\_\_dbname\_\_\_"
DBLogin="root"
DBPassword="adminadmin"
DBDateFormat="yyyy-MM-dd 00:00:00"
DBTimeFormat="1970-01-01 HH:mm:ss"
DBTimeIsDate="true"
DBVarcharLimit="3500"
SQLSERVER (es. library: sqljdbc.jar)
DBDriver="com.microsoft.sqlserver.jdbc.SQLServerDriver"
DBProtocol="jdbc:sqlserver:"
DBName="//\_\_\_hostname\_\_\_:\_\_\_portnumber\_\_\_;Database=\_\_\_dbname\_\_\_"
DBLogin="sa"
DBPassword="adminadmin"
DBDateFormat="yyyy-dd-MM 00:00:00"
DBTimeFormat="1970-01-01 HH:mm:ss"
ORACLE (es. library: ojdbc6)
DBDriver="oracle.jdbc.driver.OracleDriver"
DBProtocol="jdbc:oracle:"
DBName="thin:@\_\_\_hostname\_\_\_:\_\_\_portnumber\_\_\_:\_\_\_dbname\_\_\_"
DBLogin="system"
DBPassword="adminadmin"
DBDateFormat="yyyy-MM-dd 00:00:00"
DBTimeFormat="1970-01-01 HH:mm:ss"
DBSetDateFormat="ALTER SESSION set NLS_DATE_FORMAT = 'YYYY-MM-DD HH24:MI:SS'"
POSTGRES (es. library: postgresql-8.4-701.jdbc4.jar)
DBDriver="org.postgresql.Driver"
DBProtocol="jdbc:postgresql:"
DBName="//\_\_\_hostname\_\_\_:\_\_\_portnumber\_\_\_/\_\_\_dbname\_\_\_"
DBLogin="postgres"
DBPassword="adminadmin"
DBDateFormat="yyyy-MM-dd"
DBTimeFormat="HH:mm:ss"
Modify historicization time depth
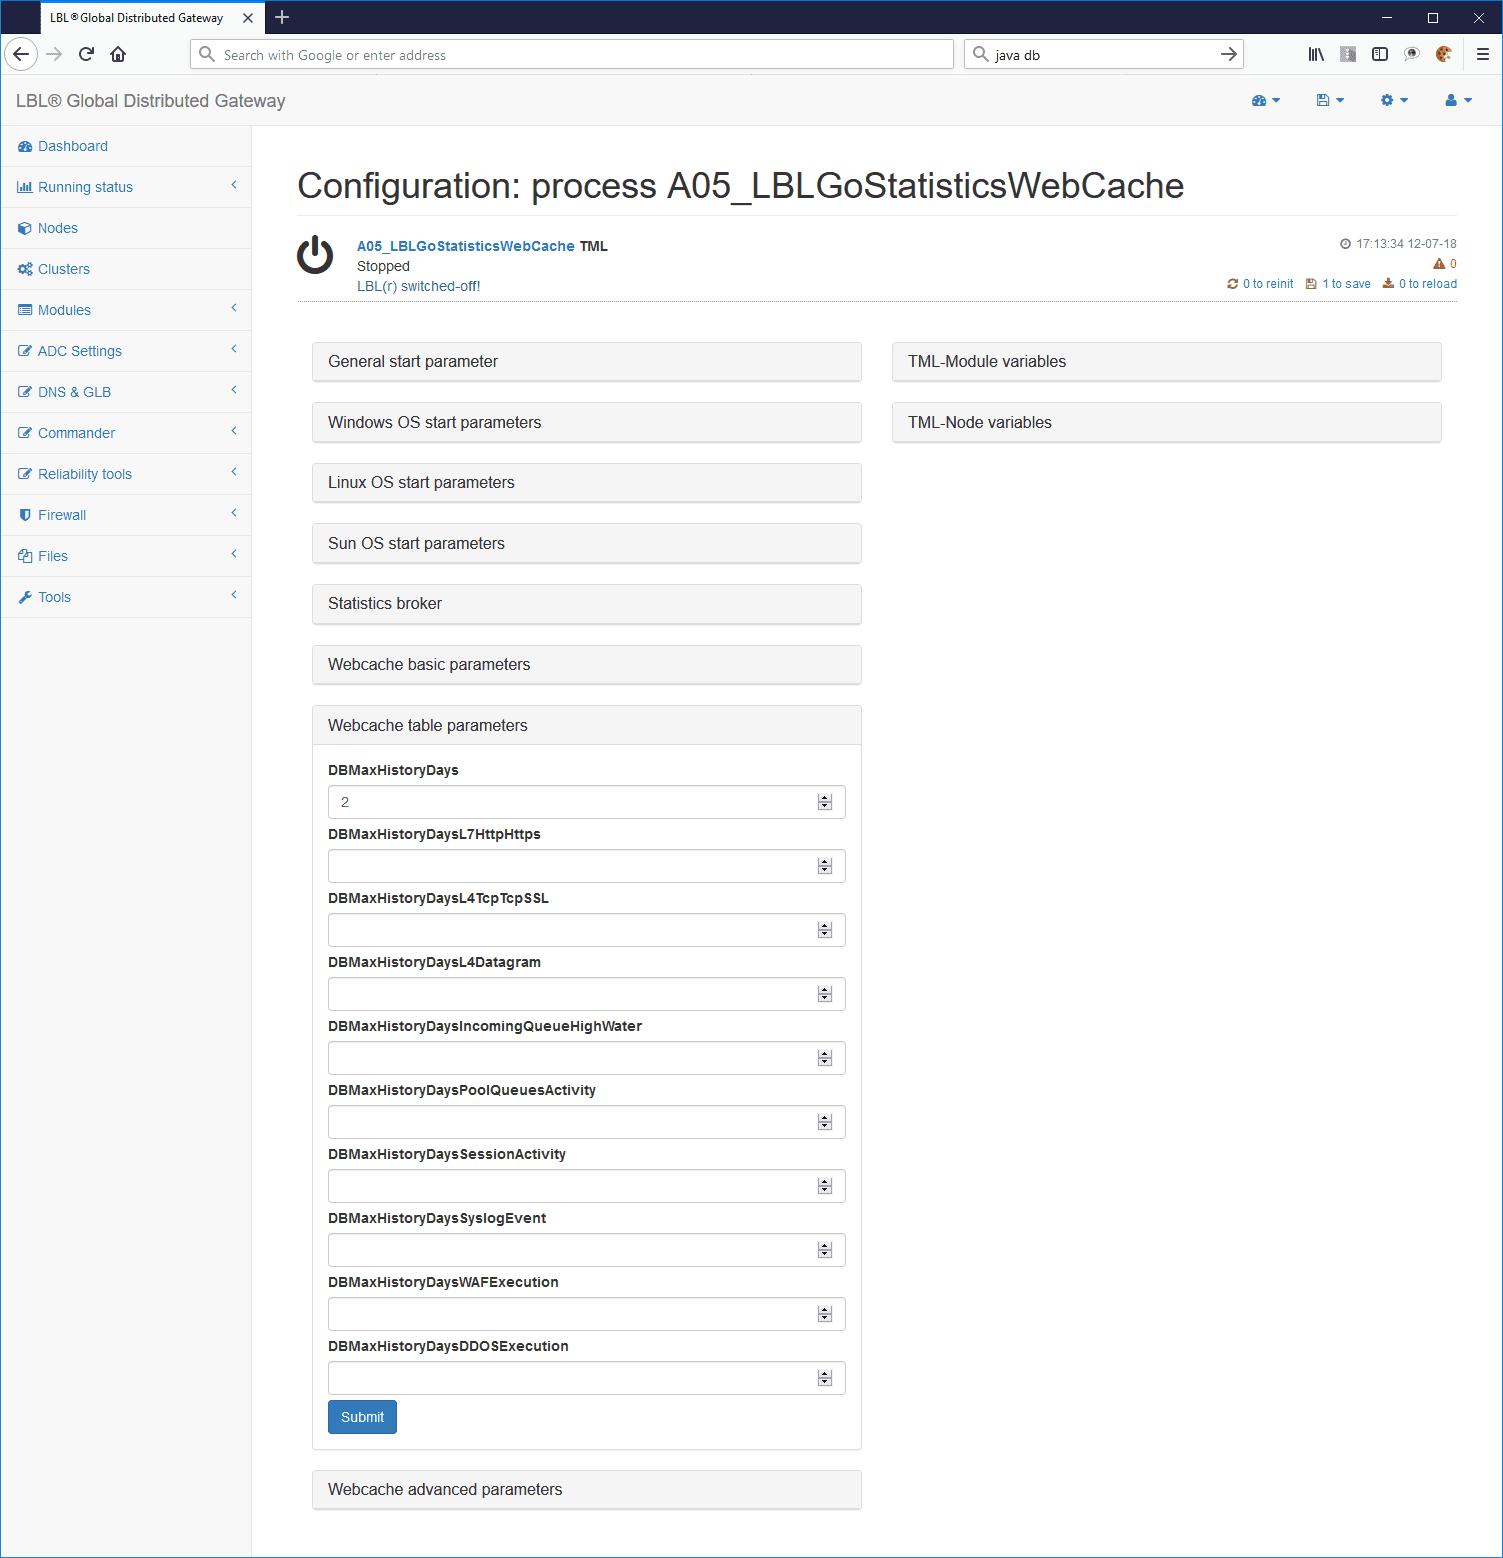
Oplon Application Delivery Controller for default parameterization historicizes the data with a depth 2-day storm. To change this behavior is enough set the ** DBMaxHistoryDays ** parameter. If this parameter comes set with a value less than or equal to 0 (zero) the statistics do not will never be deleted. Depth can also be set different time frames for the different database tables.
Checking the parameters
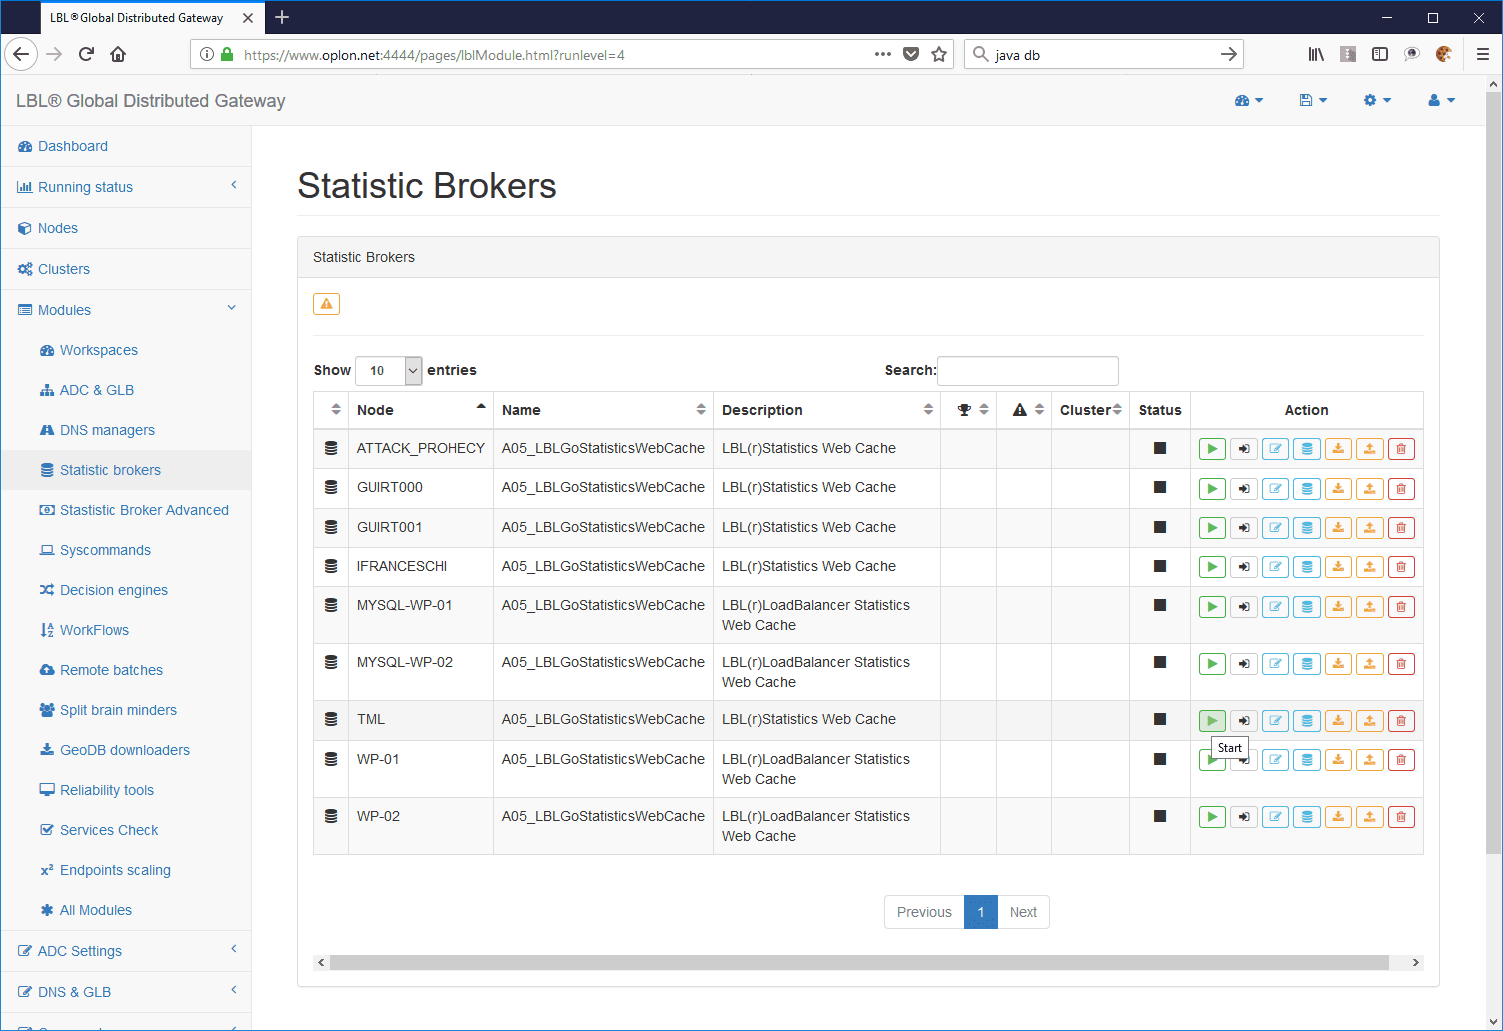
After executing the save try to start the module manually
Modules >Statistic brokers >Choose the module >Start
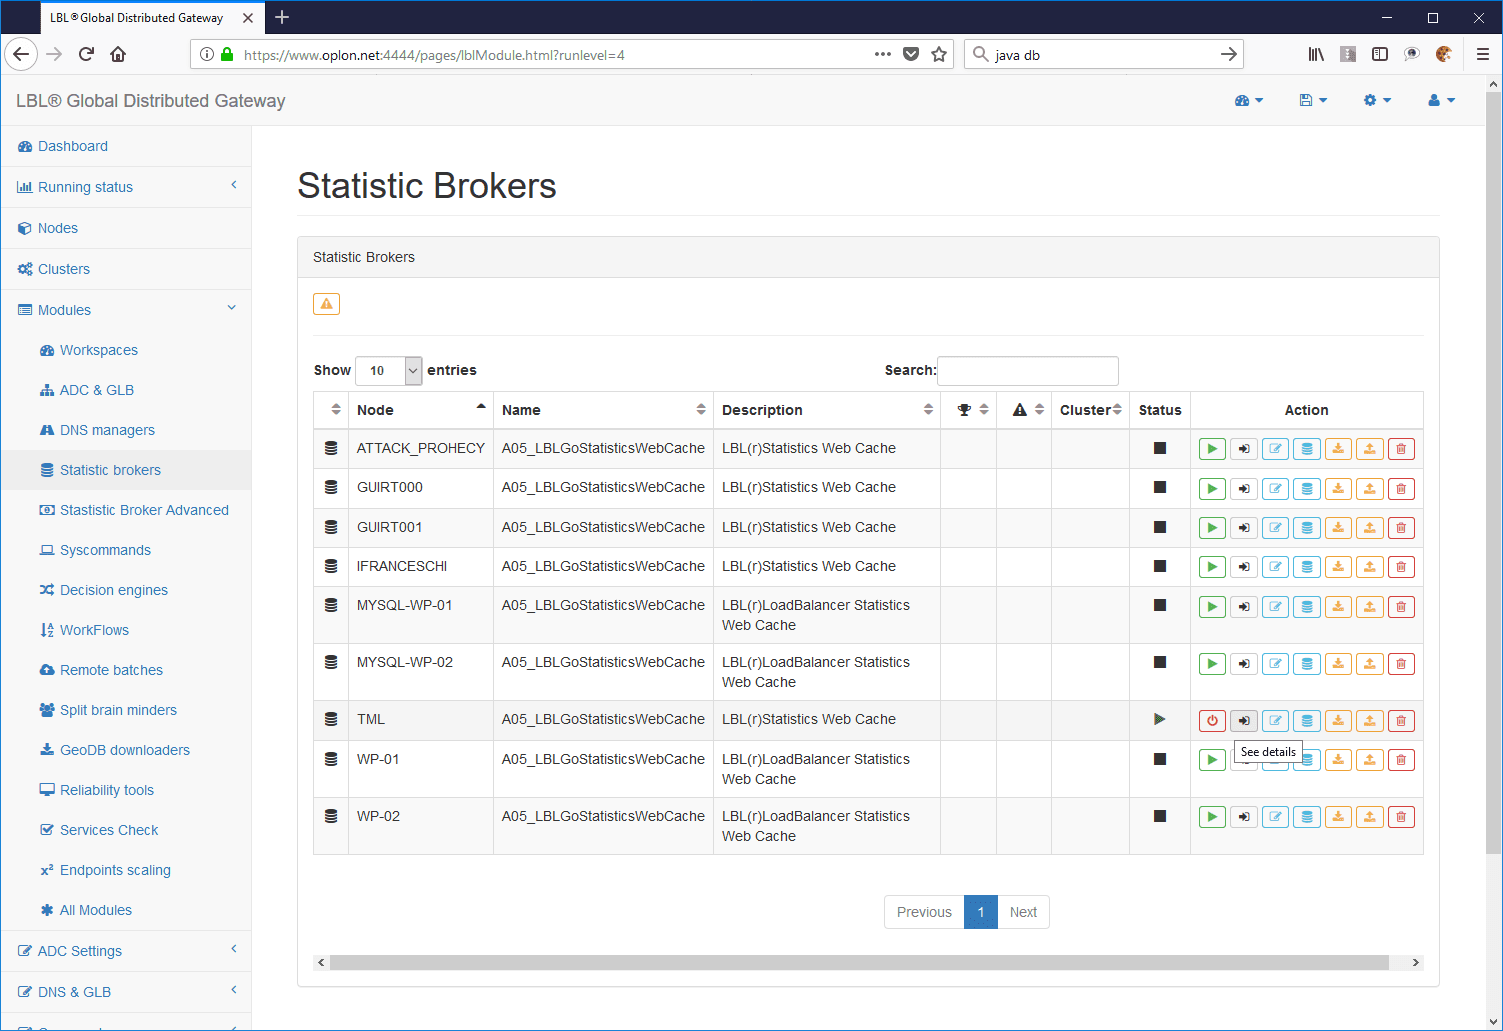
Modules >Statistic brokers >Choose the module >See details
 Modules >Statistic brokers >Choose the
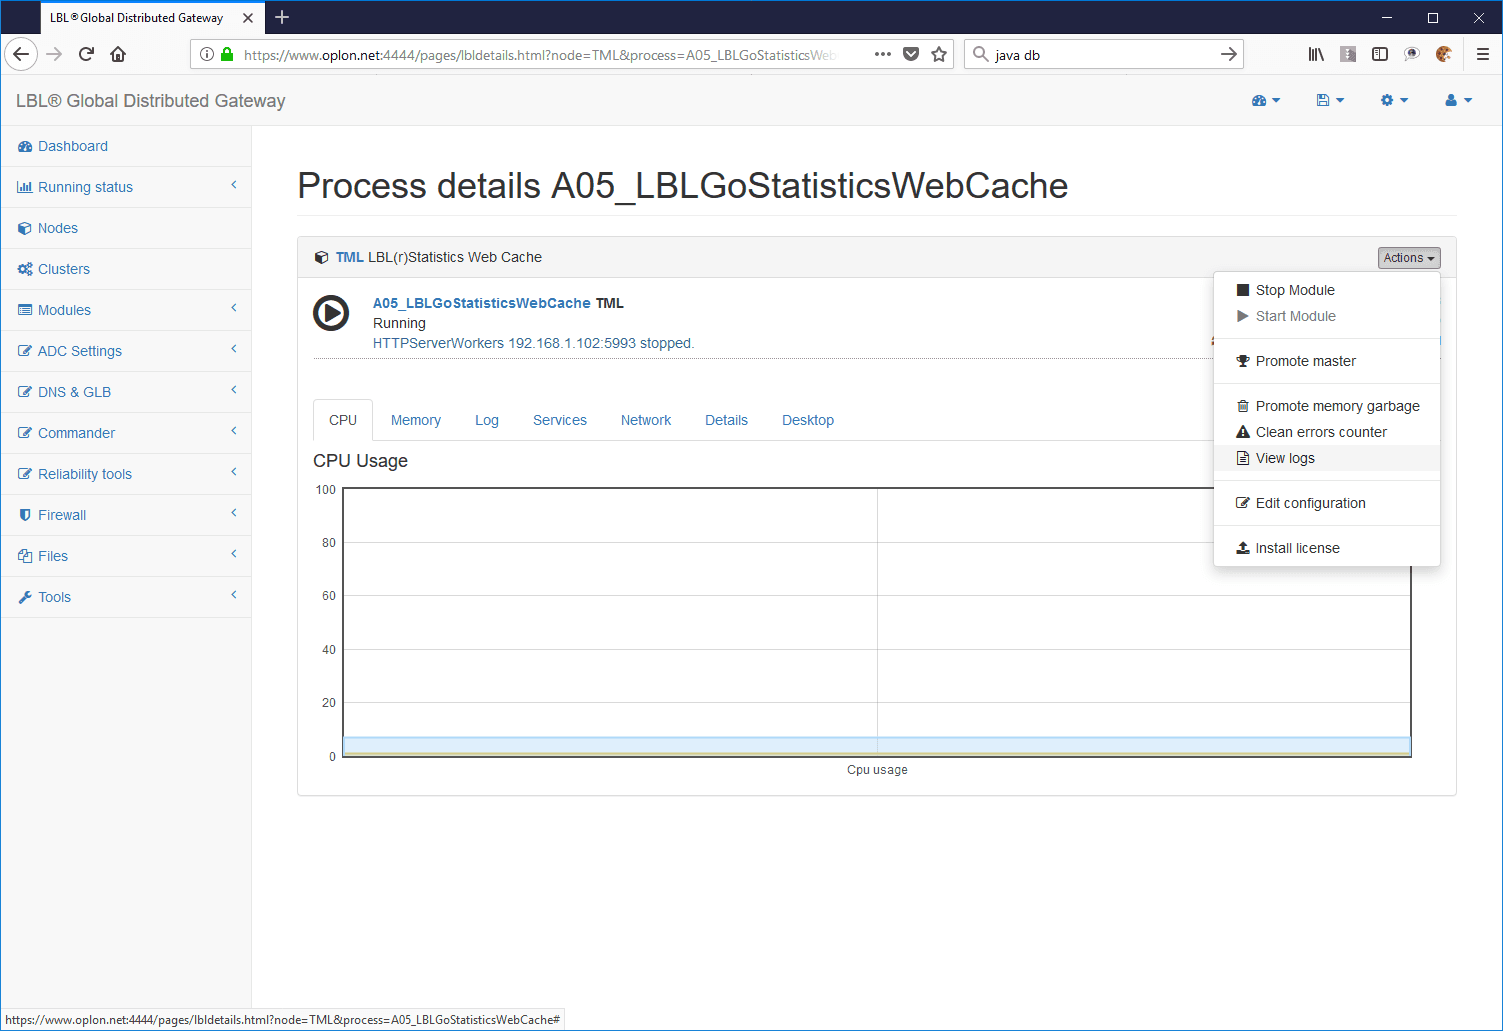
module >Actions >View logs
Modules >Statistic brokers >Choose the
module >Actions >View logs
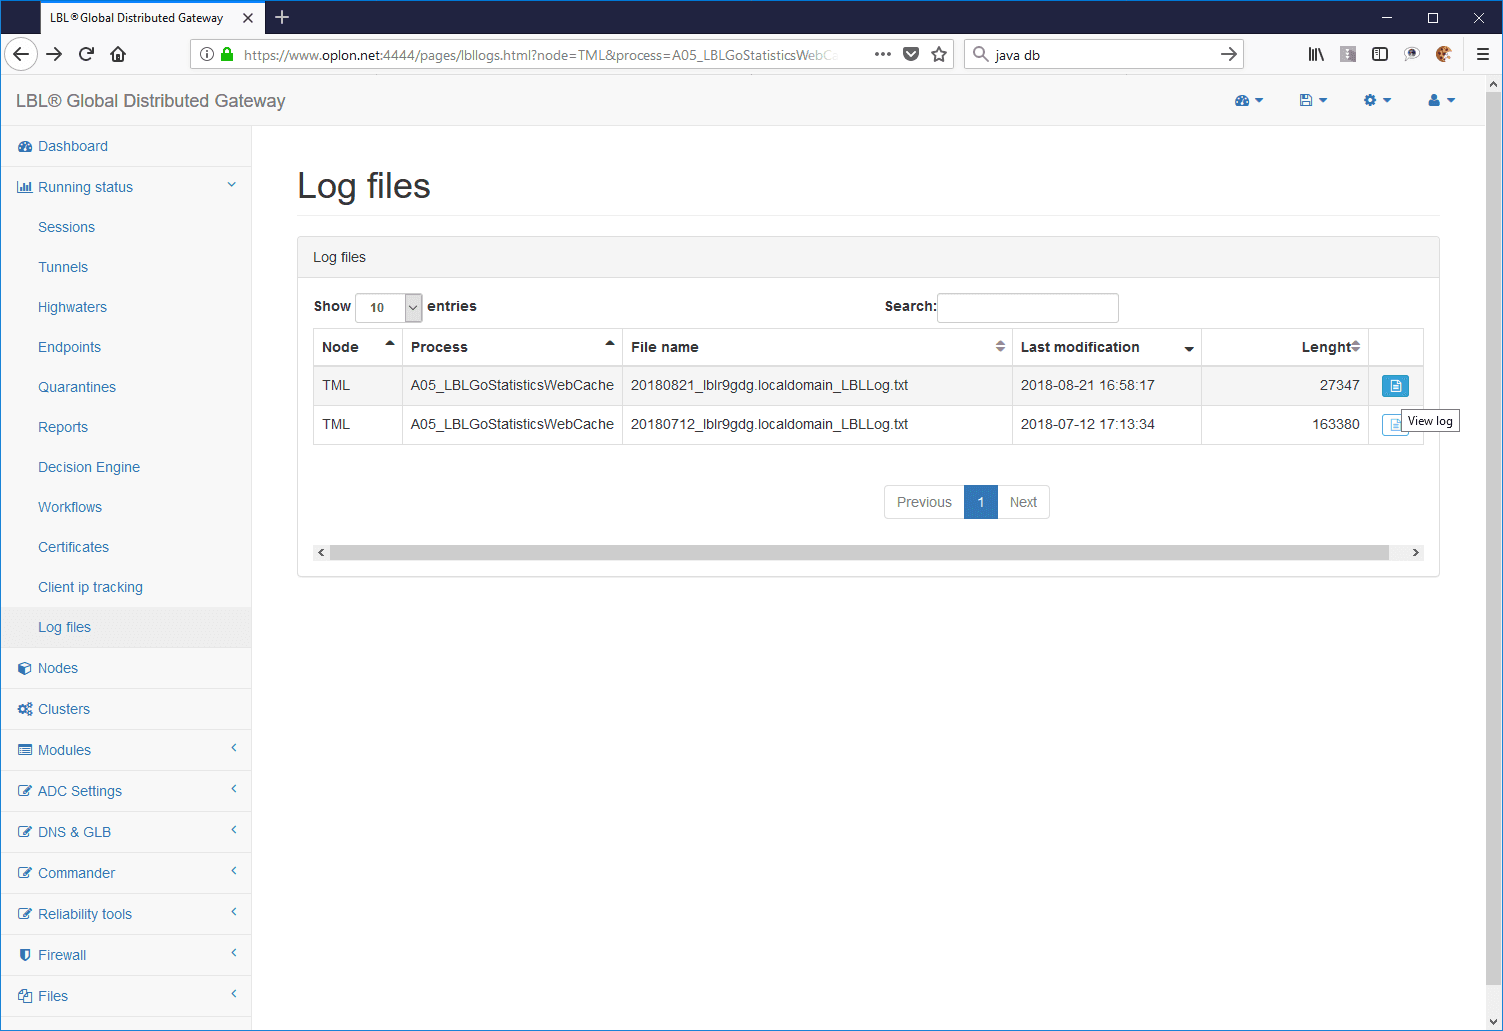 Modules >Statistic brokers >Choose the
module >Actions >View logs >View log
Modules >Statistic brokers >Choose the
module >Actions >View logs >View log
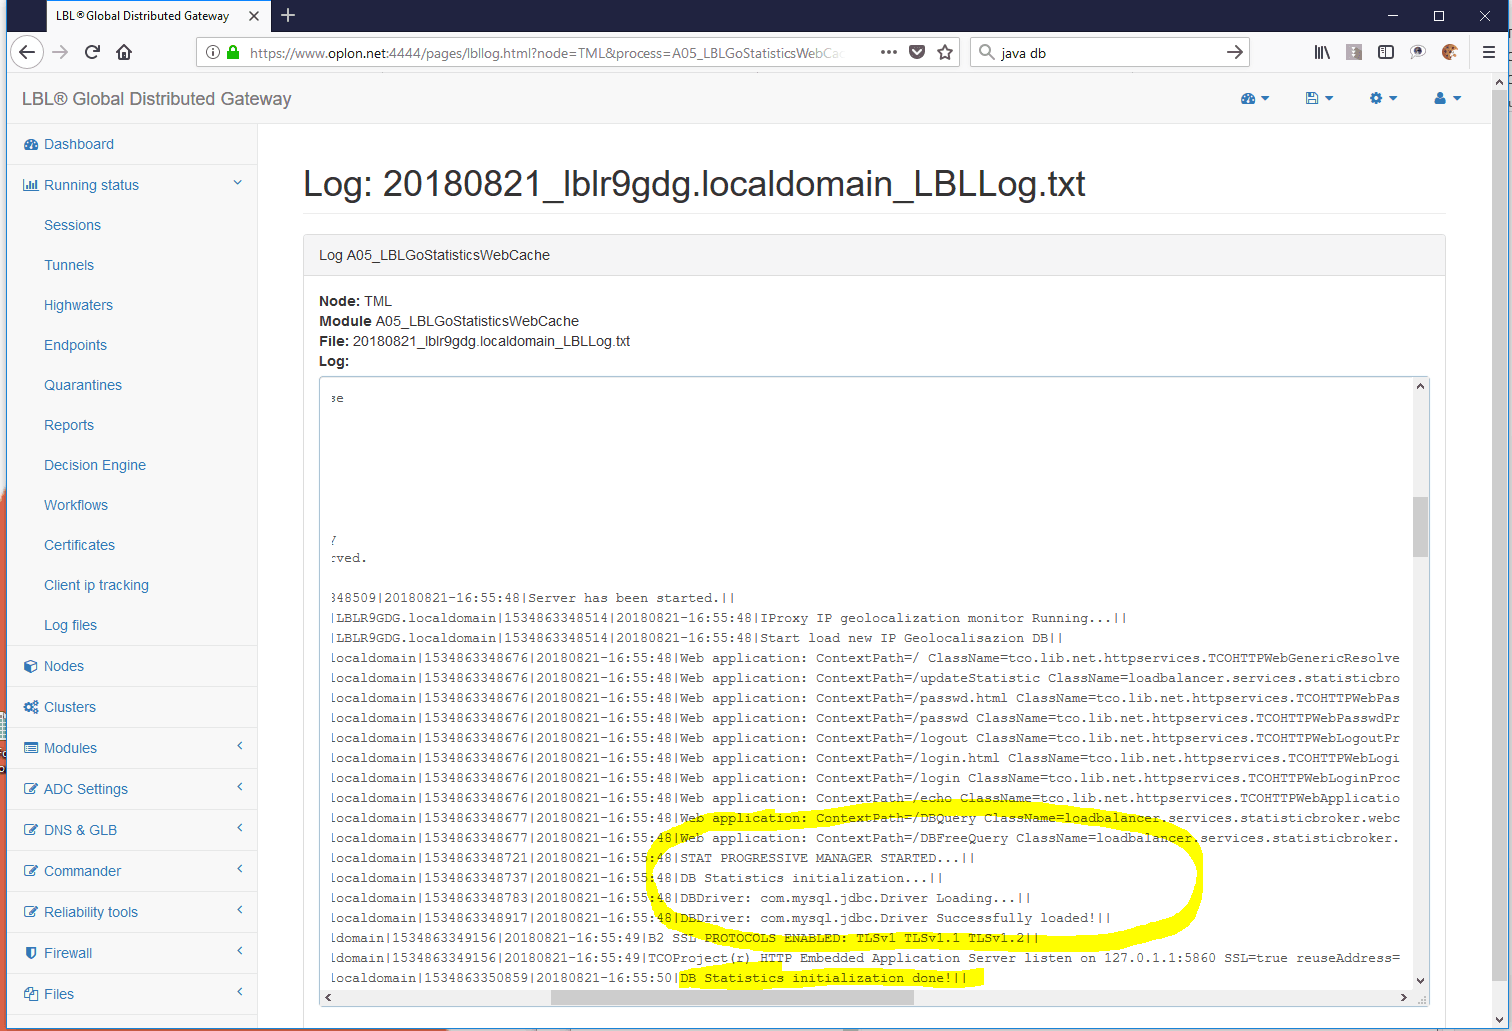 Search in the logs "DB Statistics
initialization done!"
Search in the logs "DB Statistics
initialization done!"
Ripristinare l'esecuzione automatica ...
Modules >Statistic brokers >Choose the module >Edit
Expand the General start parameters> Set Module start from panel manual to automatic
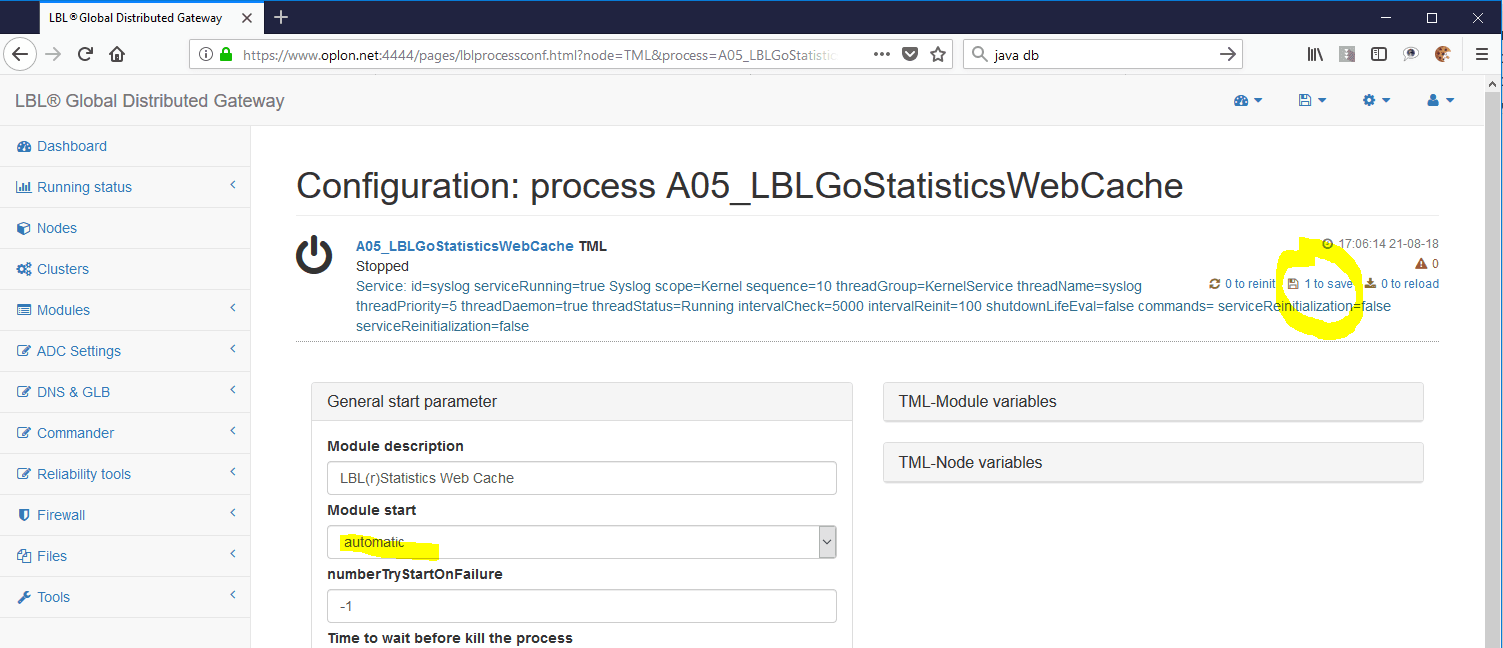
Save the parameters and wait for the module to be in the Running state
ORACLE RAC connection string
For Oracle RAC the statistical database connection string must be set so that it can reach listeners on different instances. In this regard, below is an example of a connection string with listeners attested on two hosts respectively: db1 and db2.
**DBName**= "thin:@(DESCRIPTION=(LOAD_BALANCE=on)(ADDRESS=(PROTOCOL=TCP)(HOST= <db1>)(PORT=1521))(ADDRESS=(PROTOCOL=TCP)(HOST= <db2>)(PORT=1521))(CONNECT_DATA=(SERVICE_NAME= <nome_servizio >))) "